
Figure 2
|
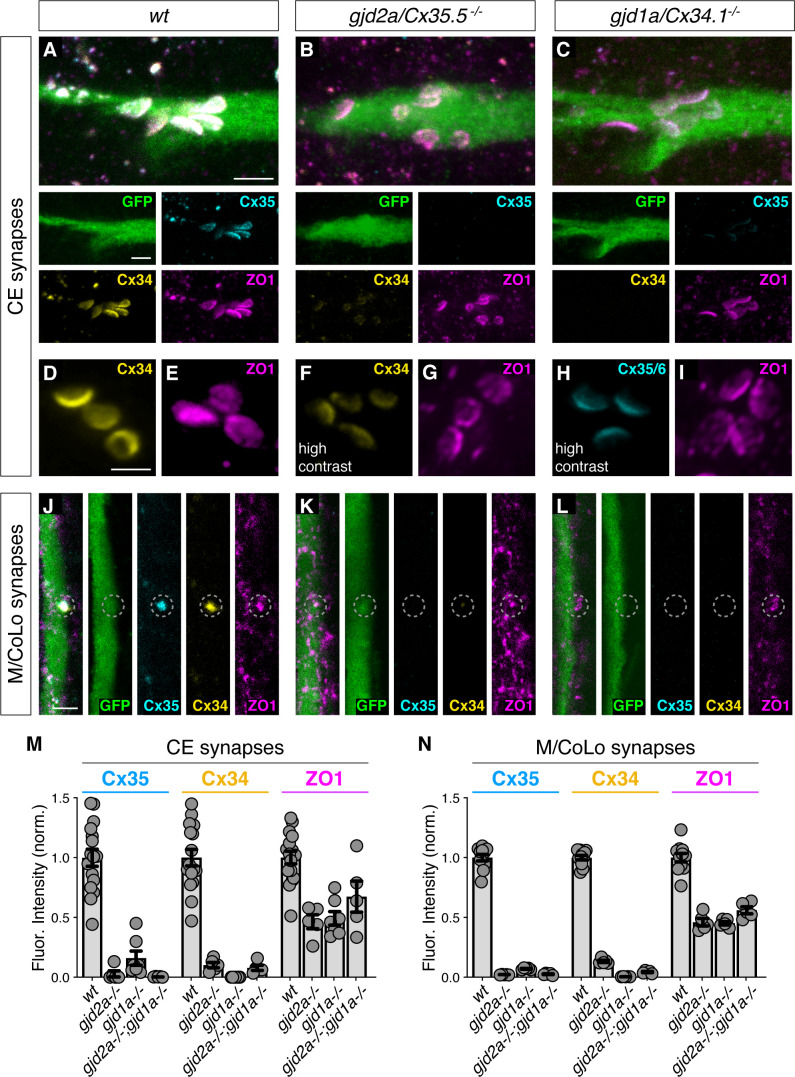
Figure 2 (A–L) Confocal images of Mauthner circuit neurons and stereotypical electrical synaptic contacts in 5-day-post-fertilization, zf206Et zebrafish larvae from wt (A,D,E,J), gjd2a/Cx35.5-/- mutant (B,F,G,K), and gjd1a/Cx34.1/- mutant animals (C,H,I,L). In panels (A–C,J–L) animals are stained with anti-GFP (green), anti-zebrafish-Cx35.5 (cyan), anti-zebrafish-Cx34.1 (yellow), and anti-human-ZO1 (magenta). In panels (D–I) animals are stained individually with the indicated antibody and in (F,H) the contrast is increased. Scale bar = 2 µm in all images. (A–C) Images of the stereotypical location of CE contact sites on the Mauthner lateral dendrite. Images are maximum-intensity projections of ~5 µm and neighboring panels show individual channels. (D–I) Images of the Mauthner CEs stained for individual electrical synapse components. Images are maximum-intensity projections of ~D ~ 2.66 µm, E ~ 1.90 µm, F ~ 1.90 µm, G ~ 0.72 µm, H ~ 2.28 µm, I ~ 2.16 µm. (F,H) Increased contrast for the Connexin channel reveals the residual staining at the synapses. (J–L) Images of the sites of contact of Mauthner/CoLo processes in the spinal cord. Images are individual Z-sections. Neighboring panels show individual channels. (M,N) Quantification of Cx35.5 (cyan), Cx34.1 (yellow), and ZO1 (magenta) fluorescence intensities at CE (M) and M/CoLo (N) synapses for the noted genotypes. wt data has been combined from all experiments. Individual data can be found in the Figure 2—source data 1. The height of the bar represents the mean of the sampled data normalized to the wt average. Circles represent the normalized value of each individual animal (CE synapse wt, mut paired experiments: wt n = 5, gjd2a-/- n = 5, wt n = 4, gjd1a-/- n = 7, wt n = 7, gjd2a-/-; gjd1a-/- n = 5; M/CoLo synapse wt, mut paired experiments: wt n = 5, gjd2a-/- n = 5, wt n = 3, gjd1a-/- n = 5, wt n = 3, gjd2a-/-; gjd1a-/- n = 5). Error bars are ± SEM. For each comparison, wt and mutant values are significantly different (Welch's t-test, p<0.01), except for the wt to gjd2a-/-; gjd1a-/- (Cx35.5/Cx34.1) double mutant comparison for ZO1 staining at CEs (p=0.842). Associated experimental statistics can be found in Figure 2—source data 1.