
Figure 1
|
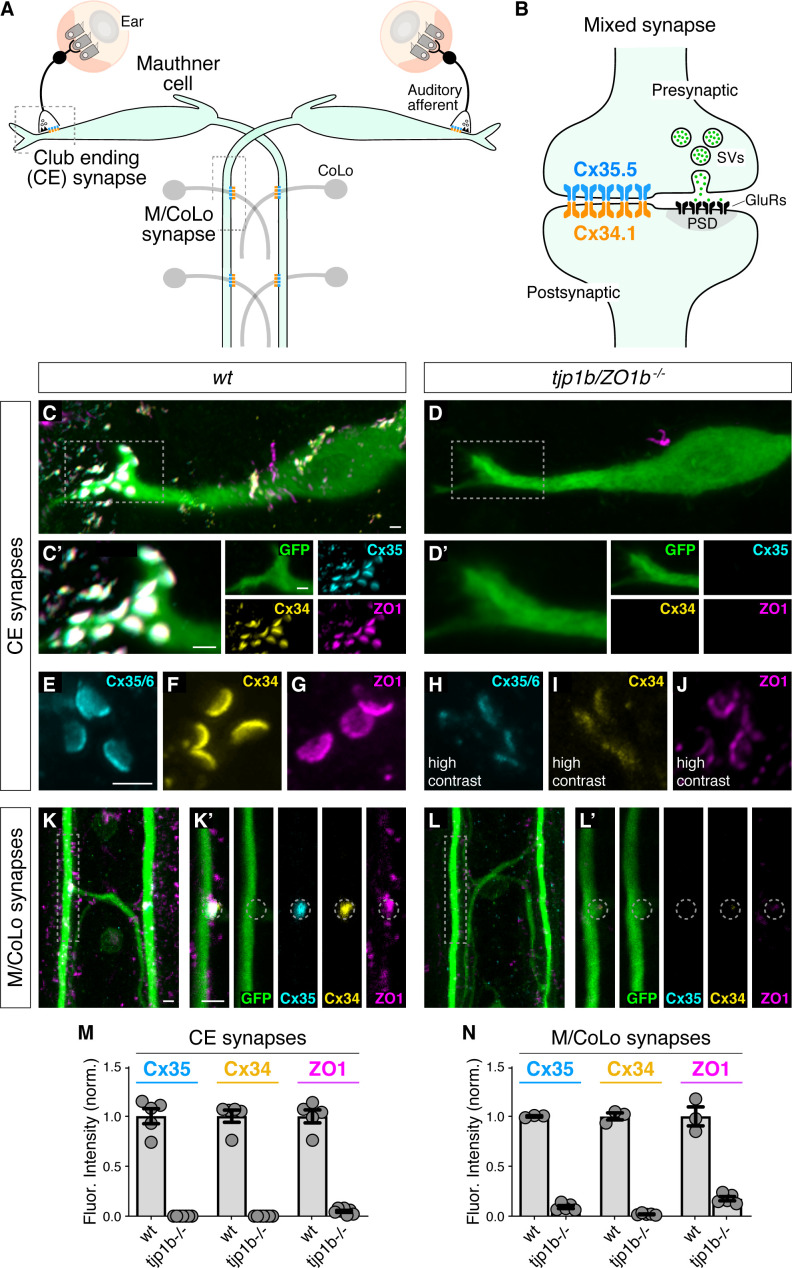
Figure 1 (A) Simplified diagram of the Mauthner cell circuit illustrating the electrical synapses of interest. The image represents a dorsal view with anterior on the top. Boxed regions indicate regions stereotypical synaptic contacts used for analysis. Presynaptic auditory afferents contact the postsynaptic Mauthner cell lateral dendrite in the hindbrain forming mixed electrical/glutamatergic Club Ending (CE) synapses. In the spinal cord, the presynaptic Mauthner axons form en passant electrical synapses with the postsynaptic CoLo interneurons (M/CoLo synapses) in each spinal cord hemisegment (2 of 30 repeating spinal segments are depicted). Electrical synapses are denoted as rectangles depicting the two Connexin (Cx) hemichannels (presynaptic Cx35.5 [cyan] and postsynaptic Cx34.1 [yellow]) that form the neuronal gap junction channels of this circuit. (B) Diagram of a mixed electrical/glutamatergic synapse as found at CEs. In the electrical component, molecularly asymmetric Connexin hemichannels (Cx35.5 [cyan], Cx34.1 (yellow)) directly couple cells. In the chemical component, presynaptic synaptic vesicles (SVs) release neurotransmitter (green circles) which align with postsynaptic glutamate receptors (GluRs). The formation and function of chemical synapses are regulated by scaffolds of the postsynaptic density (PSD, gray). (C–L) Confocal images of Mauthner circuit neurons and stereotypical electrical synapse contacts in 5-day-post-fertilization, zf206Et, transgenic zebrafish from wildtype (wt, C,E–G,K) and tjp1b/ZO1b-/- mutant animals (D,H–J,L). In panels (C,D,K,L) animals are stained with anti-GFP (green), anti-zebrafish-Cx35.5 (cyan), anti-zebrafish-Cx34.1 (yellow), and anti-human-ZO1 (magenta). In panels (E–J), animals are stained individually with the indicated antibody. Scale bar = 2 µm in all images. (C,D) Images of the Mauthner cell body and lateral dendrite in the hindbrain. Images are maximum intensity projections of ~15 µm. Boxes denote location of CE contact sites and this region is enlarged in C’ and D’. In C’ and D’ images are maximum-intensity projections of ~5 µm and neighboring panels show individual channels. (E–J) Images of the Mauthner CEs stained for individual electrical synapse components. Images are maximum-intensity projections of ~3.5 µm. In the tjp1b/ZO1b-/- mutant panels (H–J), the contrast for each channel was increased in order to visualize the staining that remained at the synapses. (K,L) Images of the Mauthner/CoLo processes and sites of contact in the spinal cord. Images are maximum-intensity projections of ~5 µm. Boxes denote regions enlarged in K’ and L’. In K’ and L’ images are individual Z-sections and neighboring panels show individual channels. (M,N) Quantification of Cx35.5 (cyan), Cx34.1 (yellow), and ZO1 (magenta) fluorescence intensities at CE (M) and M/CoLo (N) synapses for the noted genotypes. The height of the bar represents the mean of the sampled data normalized to the wt average, and circles represent the normalized value of each individual animal (CE synapses: wt n = 5, tjp1b/ZO1b-/- n = 7; M/CoLo synapses: wt n = 3, tjp1b/ZO1b-/- n = 5). Error bars are ± SEM. For each comparison, wt and tjp1b/ZO1b-/- values are significantly different (Welch's t-test, p<0.01). Associated experimental statistics can be found in Figure 1—source data 1.