
|
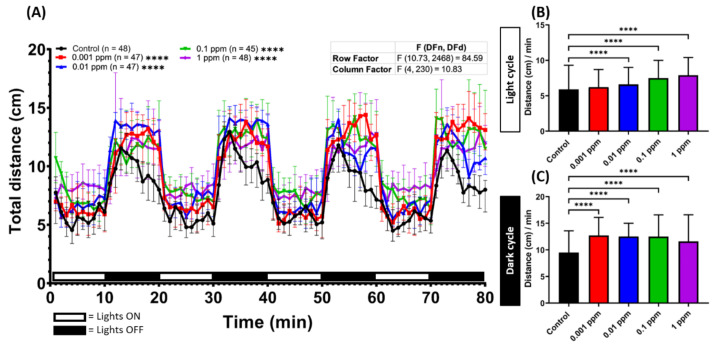
Figure 1 Arecoline induced locomotion hyperactivity in zebrafish larvae. (A) Average distance travelled per minute by 120 hpf zebrafish larvae after 1-day exposure of 0 ppm (black), 0.001 ppm (red), 0.01 ppm (blue), 0.1 ppm (green), and 1 ppm (purple) arecoline. The data are expressed as the median ±95% CI and the significance was tested by two-way ANOVA with the Geisser-Greenhouse correction. To observe the main column (arecoline) effect, Dunnett’s multiple comparison test for comparing all treatments with the control was carried out. Total average distance travelled per minute during (B) the light and (C) dark cycles at different arecoline concentrations was compared. The data are expressed as the median with interquartile range and significance was tested by the Kruskal-Wallis test continued with Dunn’s multiple comparisons as a follow-up test. Each treated group was compared with the control group (n = 48 for the control, and 1 ppm arecoline groups; n = 47 for 0.001 and 0.01 ppm arecoline groups; n = 45 for 0.1 ppm arecoline group, **** p < 0.0001).