
Image
|
Figure Caption
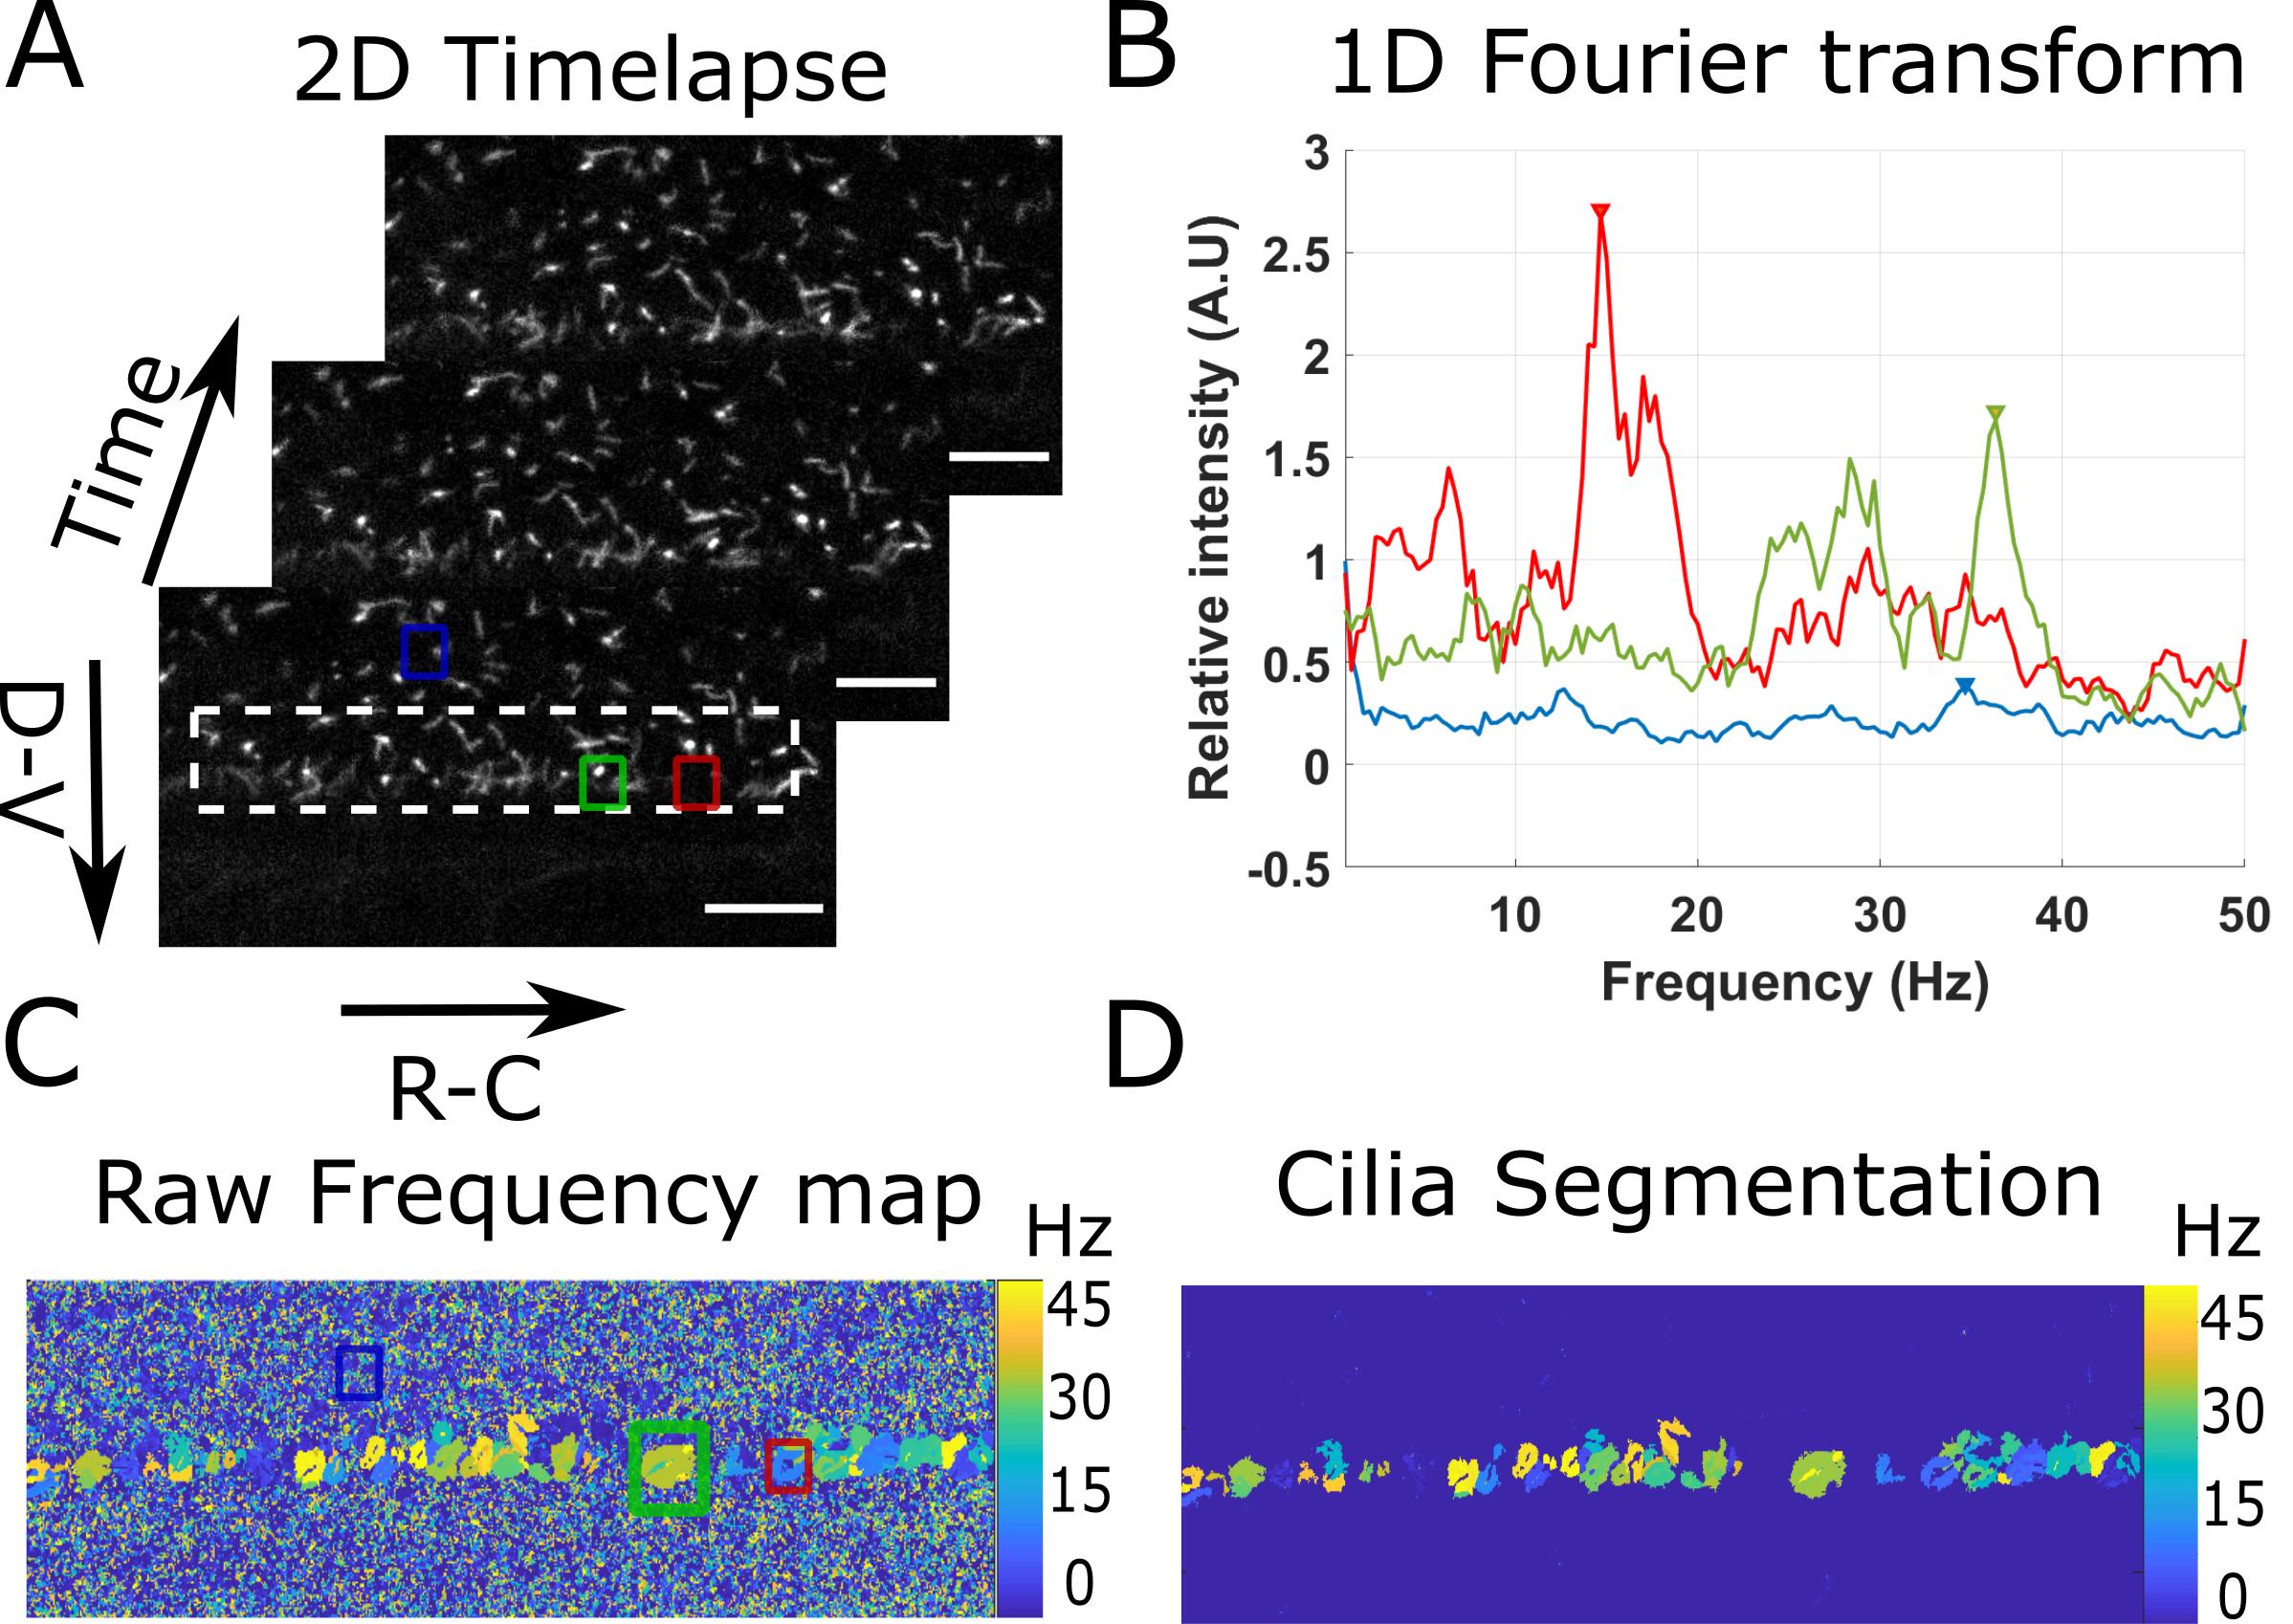
Fig. 3 Principle of the beating cilia analysis. 2D time lapses of cilia beating (A) are analyzed by measuring the time Fourier transform at each pixel (B). 3 spectra corresponding to the pixel at the center of the three regions drawn in (A) are plotted. The frequency of the peak of maximum amplitude (arrows in (B)) is extracted for all spectra, to form a frequency map (C), showing regions of constant frequency corresponding to individual cilia. All cilia are then segmented by keeping only the largest regions of constant frequency (of area above 40 pixels) (D). Scale bar is 15 µm.
Acknowledgments
This image is the copyrighted work of the attributed author or publisher, and
ZFIN has permission only to display this image to its users.
Additional permissions should be obtained from the applicable author or publisher of the image.
Full text @ Bio Protoc