
Image
|
Figure Caption
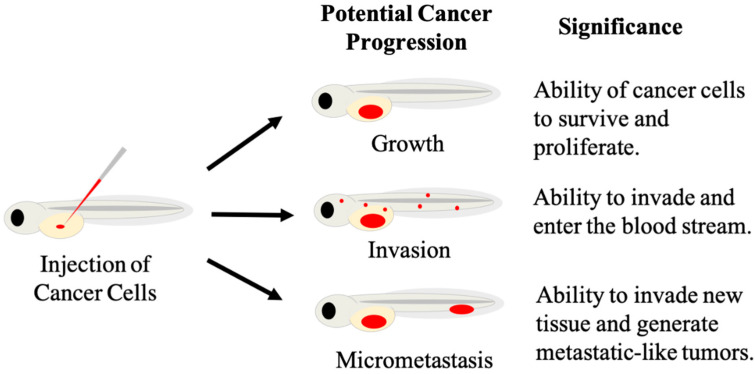
Figure 2 Diagram depicting measurable signs of cancer progression in zebrafish xenografts. Human fluorescent cancer cells (red) are injected into the yolk of embryonic zebrafish (left), with injected cells represented by the red oval. Cancer progression can display as growth, invasion or micrometastases (center). These phenotypic responses can be measured to provide information on specific cancer behavior, and responses of cancer cells to different treatments.
Acknowledgments
This image is the copyrighted work of the attributed author or publisher, and
ZFIN has permission only to display this image to its users.
Additional permissions should be obtained from the applicable author or publisher of the image.
Full text @ Biology (Basel)