
Image
|
Figure Caption
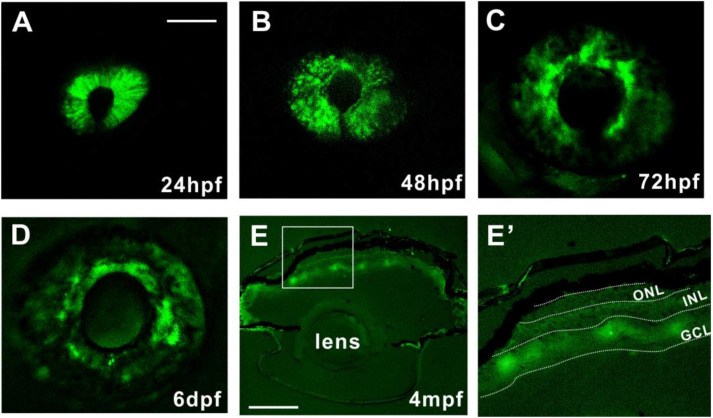
Fig. 3 Tg (ECR3-290: GFP) exhibits green fluorescence specifically in GCL. (A–D) Confocal images show Lateral view of GFP expression in retina at 24hpf, 48hpf, 72hpf and 7dpf. Fluorescence intensity and expression area was at highest at 24hpf, then the expression region diminished at 48hpf until it confines to the cells circled around outside of the lens at 72hpf. Scale bar = 100 μm (E-E′) Frozen section shows GFP expressed in GCL at 4mpf zebrafish retina. Scale bar = 1 mm. E′ shows magnification of white box in E.
Acknowledgments
This image is the copyrighted work of the attributed author or publisher, and
ZFIN has permission only to display this image to its users.
Additional permissions should be obtained from the applicable author or publisher of the image.
Reprinted from Gene expression patterns : GEP, 39, Zhang, Q., Li, T., Zhang, Y., Lin, J., Chen, X., Gui, Y., Li, Q., Comparative sequence analysis and functional validation identified a retina-specific enhancer around zic5 and zic2a, 119162, Copyright (2020) with permission from Elsevier. Full text @ Gene Expr. Patterns