IMAGE

Fig. 1

ID
ZDB-IMAGE-210419-5
Source
Figures for Don et al., 2021
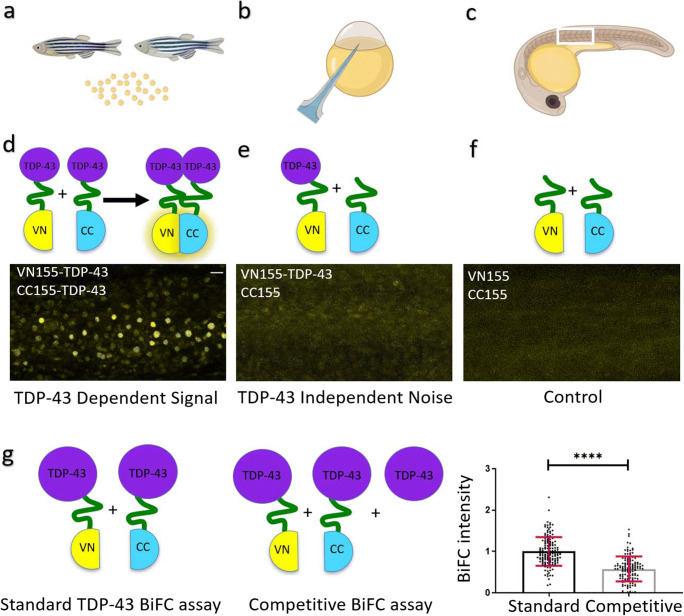
Image
Figure Caption

Fig. 1

TDP-43 aggregation in zebrafish is specific. BiFC assay to determine TDP-43 aggregation. ac Graphical illustration of the workflow. Male and female zebrafish are set up to collect the fertilized eggs (a). Eggs at the 1–2-cell stage are microinjected (b) with a combination of BiFC mRNA as illustrated below. Embryos are raised and BiFC complementation is visualized using a microscope (c). df Top schematics illustrate the different injection combinations. d TDP-43-aggregation and respective fluorescent signal in zebrafish somites at 24 hpf. e TDP-43-independent signal (noise). f Control (background) fluorescence at 24 hpf. Scale bar represents 20 μm. g Comparison of BiFC intensity after standard and competitive TDP-43 BiFC injections. The bar diagram shows the quantitative comparison of the normalized BiFC intensity in this fluorescence complementation assay. Dot points represent individual fish and data were pooled from 4 independent experiments. ****P < 0.0001

Acknowledgments
This image is the copyrighted work of the attributed author or publisher, and ZFIN has permission only to display this image to its users. Additional permissions should be obtained from the applicable author or publisher of the image. Full text @ Mol. Neurobiol.