IMAGE

Fig. 3

ID
ZDB-IMAGE-210419-11
Source
Figures for Gordon et al., 2021
Image
Figure Caption

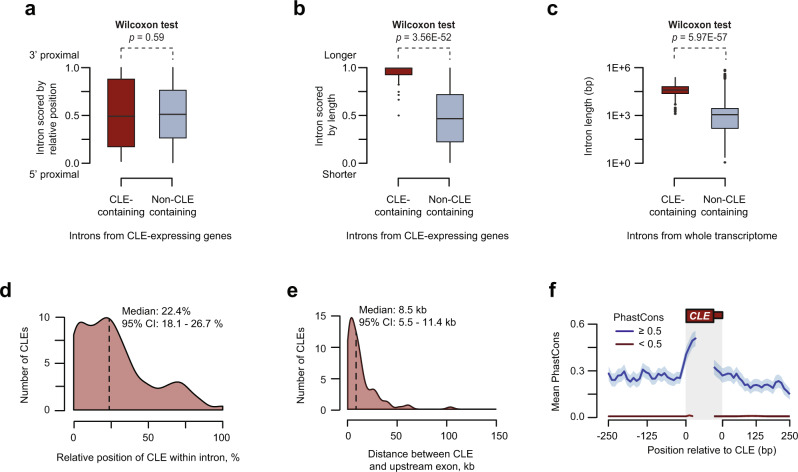
Fig. 3 Molecular properties of CLEs.

a, b CLE containing (n = 109) and non-CLE (n = 1557) containing introns from CLE-expressing genes were scored by their relative position (a) and relative length (b), and the distributions of these scores were plotted. Note that CLE-containing introns show no gene position bias but tend to be among the longest introns in the gene. The box bounds represent the first and third quartiles and the black lines at the middle of the boxes show the medians. Top and/or bottom whiskers represent 1.5x of the range between the third and the first quartiles (interquartile range). Circles represent outliers. Two-sided Wilcoxon rank sum test was performed. c CLE-containing introns (n = 109) are longer compared to all other introns in the zebrafish transcriptome (n = 209,012). The box bounds represent the first and third quartiles and the black lines at the middle of the boxes show the medians. Top and/or bottom whiskers represent 1.5x of the range between the third and the first quartiles (interquartile range). Circles represent outliers. Two-sided Wilcoxon rank-sum test was performed. d CLEs tend to occur relatively close to the 5′ end of their host introns. e CLEs are found within 10 kb of the upstream constituitive exon. f Metaplot showing the conservation score of sequences surrounding conserved (blue) and non-conserved (red) CLEs. In all, 280 bp of surrounding intron/CLE junction sequence (250 bp intron and 30 bp exon) were binned into 10 bp windows and the mean PhastCons score for each bin is shown ±SEM.

Acknowledgments
This image is the copyrighted work of the attributed author or publisher, and ZFIN has permission only to display this image to its users. Additional permissions should be obtained from the applicable author or publisher of the image. Full text @ Nat. Commun.