IMAGE

Fig. 2

ID
ZDB-IMAGE-210419-10
Source
Figures for Gordon et al., 2021
Image
Figure Caption

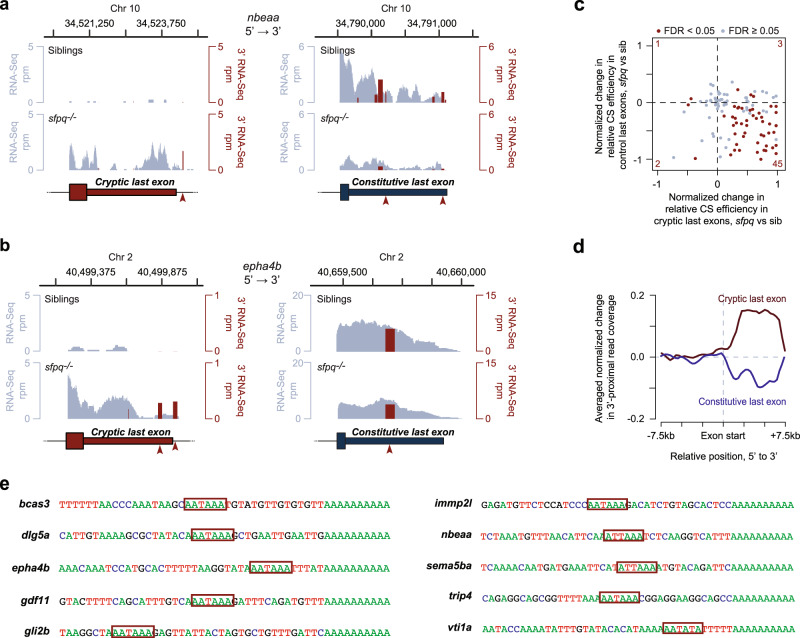
Fig. 2 CLEs are cleaved and polyadenylated.

a, b Representative coverage plots from RNA-seq (light blue) and 3′ mRNA-seq (red) experiments showing cryptic last and constitutive last exons. Only clustered reads are shown in the 3′ mRNA-seq profile and consensus polyadenylation signals (PASs) are marked by red arrowheads. c Four-way dot plot representing the change in relative cleavage site usage (sfpq vs sib) for CLEs (x-axis) against its corresponding constitutive last exons (y-axis; control). A positive value on each axis represents an increased CS usage in sfpq−/− null. Genes showing significantly changing CS usage in both CLE and control (FDR < 0.05) are colored red and the total number of significantly regulated genes is indicated for each quadrant. d Metaplot of the normalized change in 3′ mRNA-seq coverage within regions surrounding CLEs (red) and constitutive last exons (blue; control). e Sanger sequencing of 3′RACE PCR products of CLE isoforms. PAS hexamers are shown within red boxes.

Acknowledgments
This image is the copyrighted work of the attributed author or publisher, and ZFIN has permission only to display this image to its users. Additional permissions should be obtained from the applicable author or publisher of the image. Full text @ Nat. Commun.