
|
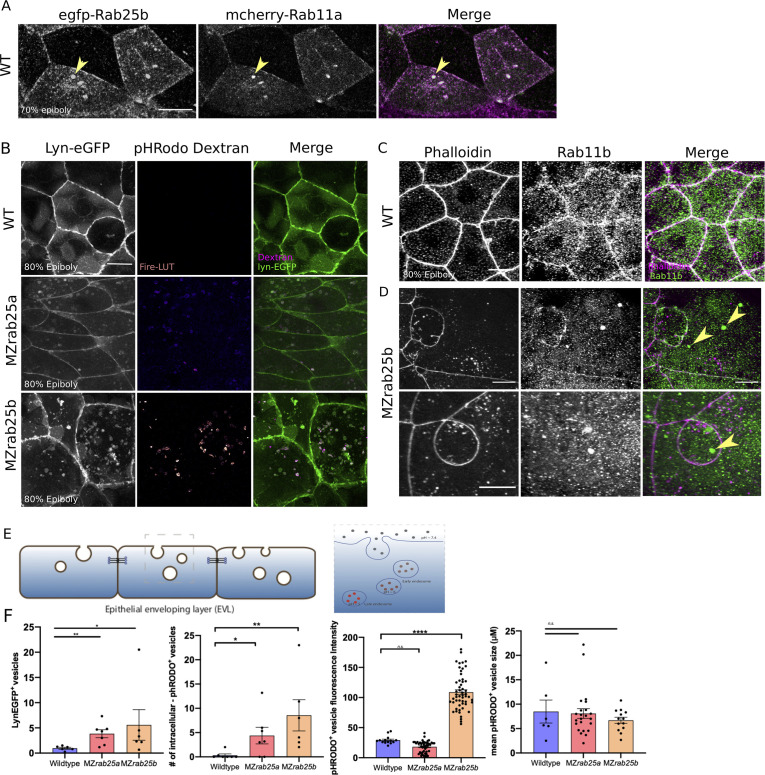
Figure 7 (A) z-projection stills of a wild-type embryo at 80% epiboly co-expressing mCherry-Rab11a (green) and eGfp-Rab25b (magenta); arrowhead denotes overlap. (B) Live WT, MZrab25a and MZrab25b embryos expressing Lyn-eGfp (green) and containing cytoplasmic pHRodo dextran puncta (magenta) following incubation. Scale bar 20 μm. (C,D) Rhodamine phalloidin stained (magenta) and Rab11b antibody (green) stained WT and MZrab25b embryos at 80% epiboly; arrowheads denote large Rab11b endosomes. Scale bar 20 μm (E) Schematic of pHRodo dextran apical endocytosis (F) Mean number of Lyn-eGfp- or pHRodo-positive vesicles/cell. WT, MZrab25a and MZrab25b embryos (N = 7,7,6). Fluorescence intensity measured over a 1 μm line in pHRodo-positive vesicles; WT (n = 15); MZrab25a (n = 46); MZrab25b (n = 54). Mean surface area of pHRodo vesicles; WT(n = 6); MZrab25a and MZrab25b (n = 23,13). Means: SEM; significance using Mann-Whitney test. Scale bars, (A–C) 20 μm.