
|
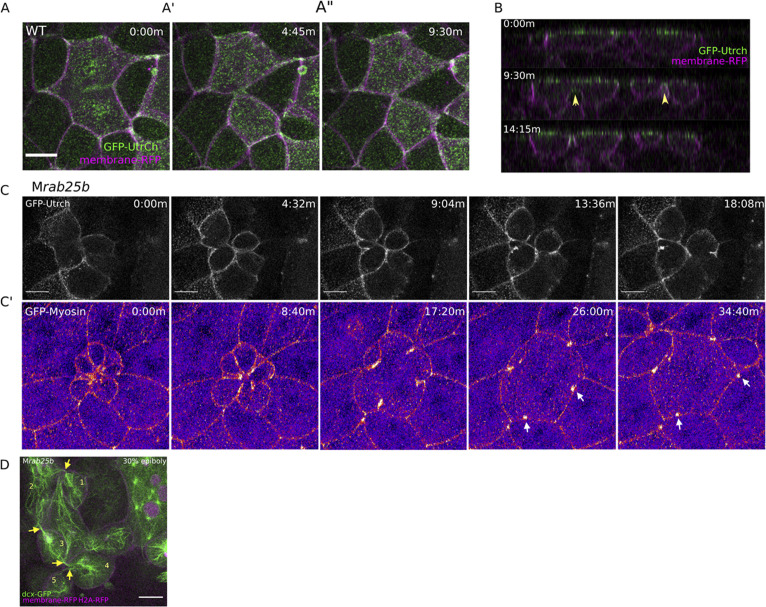
Figure 4 (A–A”) Confocal z-projections of stills from time-lapse of a WT EVL cell during mitosis expressing Gfp-Utrophin (green) and mRfp (magenta). Scale bar 20 μm. (B) Lateral views with apical to the top of stills from single-plane confocal time-lapses of WT EVL cells during mitosis expressing Gfp-Utrophin (green) and mRfp (magenta). Arrowheads denote cleavage furrow ingression from basal to apical. (C) Confocal z-projections of stills from time-lapse of MZrab25b multipolar cleavage failure. F-actin labeled with Gfp-Utrophin. Scale bar 20 μm. (C’) Confocal z-projections of time-lapse of MZrab25b Tg (Myl1.1-Gfp) (Fire-LUT) during multipolar cytokinesis failure. White arrows indicate Myosin-Gfp foci. (D) Confocal z-projection of MZrab25b embryo showing an array of EVL cells interconnected via cytokinetic bridges at 30% epiboly. Microtubules (green), nuclei (magenta), and plasma membrane (magenta), arrows and numbers denote connected cells and cytokinetic bridges. Scale bar 20 μm.