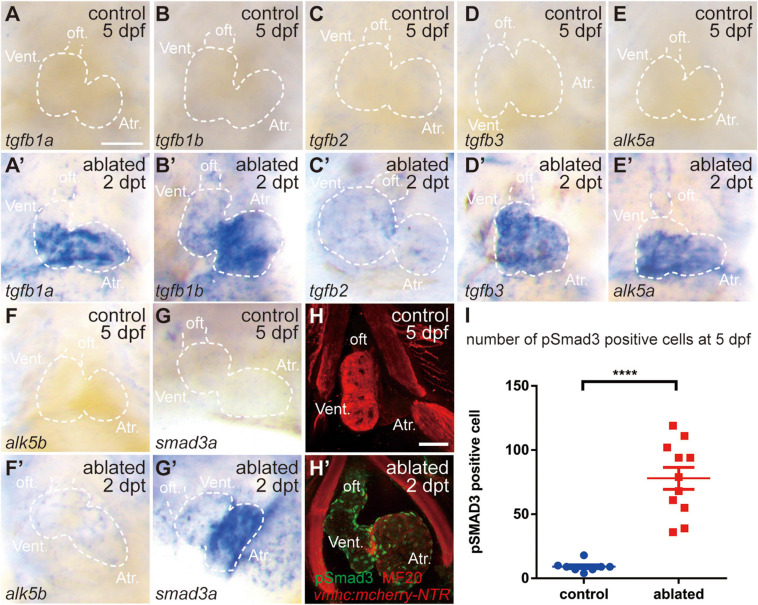
IMAGE

FIGURE 1

ID
ZDB-IMAGE-210409-86
Genes
Antibodies
Source
Figures for Peng et al., 2021
Image
Figure Caption

FIGURE 1

TGF-β/Smad3 signaling is activated during zebrafish ventricular regeneration. (A–G′) Whole-mount in situ hybridization showing that the expression of components of the TGF-β signaling pathway, tgfb1a, tgfb1b, tgfb2, tgfb3, alk5a, alk5b, and smad3a, was upregulated in the ablated hearts (A′–G′) compared with that in the control hearts (A–G) at 5 dpf/2 dpt. Dashed lines outline the hearts. (H–H′) Representative immunostaining images of Tg(vmhc:mCherry-NTR) hearts showing that phospho-Smad3 signal was increased in the ablated hearts (H′) than in the control hearts (H) at 5 dpf/2 dpt. Green, anti-pSmad3; red, MF20 (anti-MHC). (I) Quantification of phospho-Smad3-positive cells in the control and ablated hearts at 5 dpf/2 dpt (N = 8 and 11, respectively). Mean ± s.e.m., Student’s t-test, two-tailed, ****P < 0.0001. Scale bars, 50 μm. dpf, days post-fertilization; dpt, days post-treatment; atr., atrium; oft., out flow tract; vent., ventricle.

Figure Data
Acknowledgments
This image is the copyrighted work of the attributed author or publisher, and ZFIN has permission only to display this image to its users. Additional permissions should be obtained from the applicable author or publisher of the image. Full text @ Front Cell Dev Biol