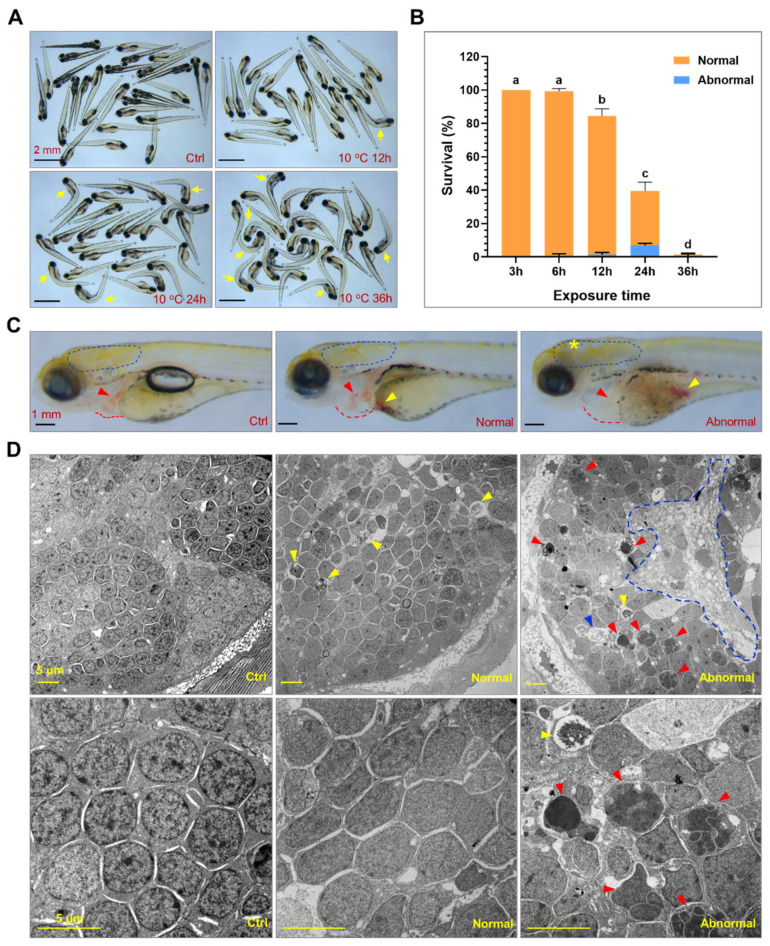
Figure 1 Exposure to lethal cold stress resulted in irreversible and systematic tissue damage. (A) Photos of zebrafish larvae exposed to 10 °C for different time periods. The controls (ctrl) were the larvae developed to 120 hpf under 28 °C. The yellow arrows indicate dead fish. (B) Survival rates of larvae under lethal cold stress. The larvae at 96 hpf were exposed to 10 °C for indicated time periods. After recovered at 28 °C for 24 h, the larvae were classified as normal and abnormal based on their morphologies and ability to swim. Different letters above the error bars indicate significant difference (n = 4, p < 0.05). (C) Representative photos of the control, normal and abnormal larvae. The circles of dashed blue lines indicate brain. The red and yellow arrows indicate heart and red blood cells accumulated in the yolk sac. The yellow star indicates damage in the brain. The red dashed lines indicate border of pericardial cavity. (D) Transmission electron microscopy disclosed cold-induced cell death in the brain. The brain of zebrafish larvae (indicated by the dashed blue line circles in (C) was ultrathin-sectioned and imaged. The blue, red and yellow arrow heads indicate the cells undergoing necrotic, apoptotic and autophagic death, respectively. The circle of blue dashed line indicates area of necrosis. Photos of the lower panel are magnified regions of those of the upper panel.
Image
Figure Caption
Acknowledgments
This image is the copyrighted work of the attributed author or publisher, and
ZFIN has permission only to display this image to its users.
Additional permissions should be obtained from the applicable author or publisher of the image.
Full text @ Int. J. Mol. Sci.

