
Image
|
Figure Caption
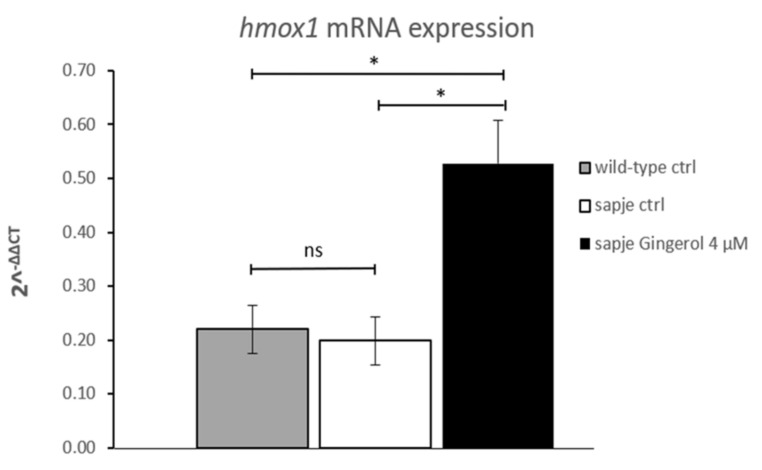
Figure 2 Quantitative real-time PCR analysis of hmox1 mRNA in untreated (wild-type (WT) n = 75; sapje CTRL, n = 75) and in treated (gingerol 4 µM, n = 75) homozygous sapje larvae. The error bars show the standard error of the mean (SEM). * p ≤ 0.05, ns p > 0.05.
Figure Data
Acknowledgments
This image is the copyrighted work of the attributed author or publisher, and
ZFIN has permission only to display this image to its users.
Additional permissions should be obtained from the applicable author or publisher of the image.
Full text @ Nutrients