
|
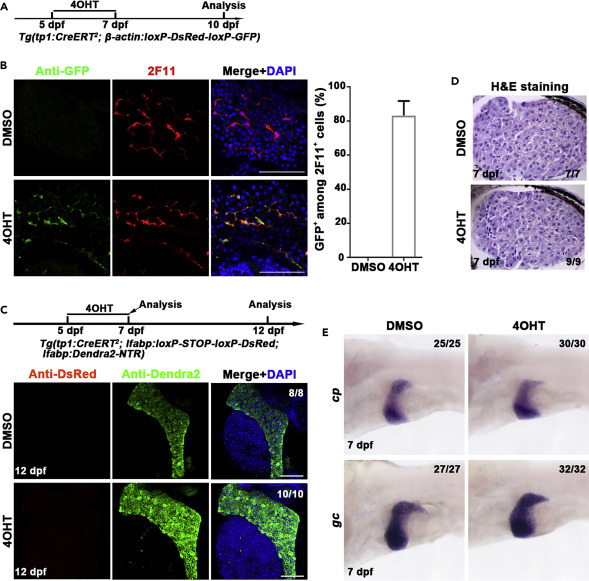
Fig. 1 Establishment of the lineage tracing system specific for the detection of BEC-to-hepatocyte conversion (A) Experimental scheme illustrating the stage of 4OHT treatment to double transgenic line, Tg(tp1:CreERT2; β-actin:loxP-DsRed-loxP-GFP) from 5 dpf to 7 dpf and analysis at 10 dpf. (B) Immunostaining for 2F11 and GFP on livers (2D imaging) showing tp1-CreER labels the 2F11-positive cholangiocytes specifically after 4OHT treatment. Nuclei were stained with DAPI (4',6-diamidino-2-phenylindole) (blue). Quantification of the percentage of GFP+ among 2F11+ cells in DMSO- (n = 5) and 4OHT (n = 6)-treated livers at 10 dpf. (C) Experimental scheme illustrating the stage of 4OHT treatment to triple transgenic line Tg(tp1:CreERT2; lfabp: loxP-STOP-loxP-DsRed; lfabp:Dendra2-NTR) from 5 dpf to 7 dpf and analysis at 12 dpf. Immunostaining for DsRed and Dendra2 in livers (3D imaging) showing no DsRed positive cells in Dendra2+ cells. Nuclei were stained with DAPI (blue). (D) H&E staining images showing normal liver histologies at 7 dpf after DMSO and 4OHT treatment. (E) Whole-mount in situ hybridization images showing the expression of cp and gc in DMSO and 4OHT treatment at 7 dpf. Scale bars: 100 μm. Data are represented as mean ±SEM(Standard Error of Mean). See also Figure S1.