
|
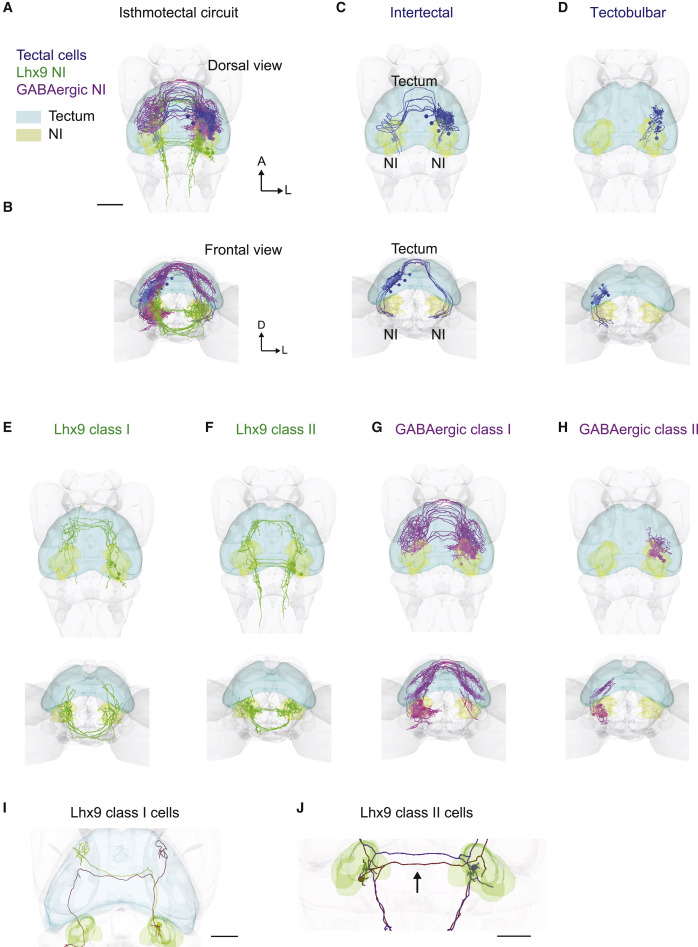
Fig. 7 (A) Cellular-resolution atlas of isthmotectal circuitry showing single-cell reconstructions. Shown are tectal cells in blue, lhx9-positive NI cells in green, and GABAergic-positive NI cells in magenta, dorsal view, and masks for the tectum and NI (light blue and yellow, respectively). (B) Same as (A) but frontal view. (C) Intertectal cells with a bifurcated axon, terminating in the vicinity of the NI on both sides. (D) Tectobulbar neurons targeting the ipsilateral NI. (E) Lhx9-positive NI cells (class I) projecting first to the ipsilateral tectum and then to the contralateral tectum. (F) Lhx9-positive NI cells (class II) projecting first to the contralateral NI, close to the contralateral tectum, and then to the ipsilateral tectum. (G) GABAergic-positive NI cells (class I) projecting first to the ipsilateral tectum and then to the contralateral tectum. (H) GABAergic-positive NI cells (class II) projecting only to the ipsilateral tectum. For each morphological type, dorsal and frontal views are shown. (I) Example of two Lhx9 class I cells with projections to the tectum. Both cell bodies are on the right. The brown cell shows terminations mainly in the ipsilateral tectum, whereas the green cell shows termination mainly in the contralateral tectum. (J) Example of reciprocal projections of two Lhx9 class II NI cells. The red cell has its soma in the left NI and terminations in the right NI. The purple cell has its soma in the right NI and terminations in the left NI. Both cells have descending projections to the hindbrain. Scale bars, 50 μm.