
|
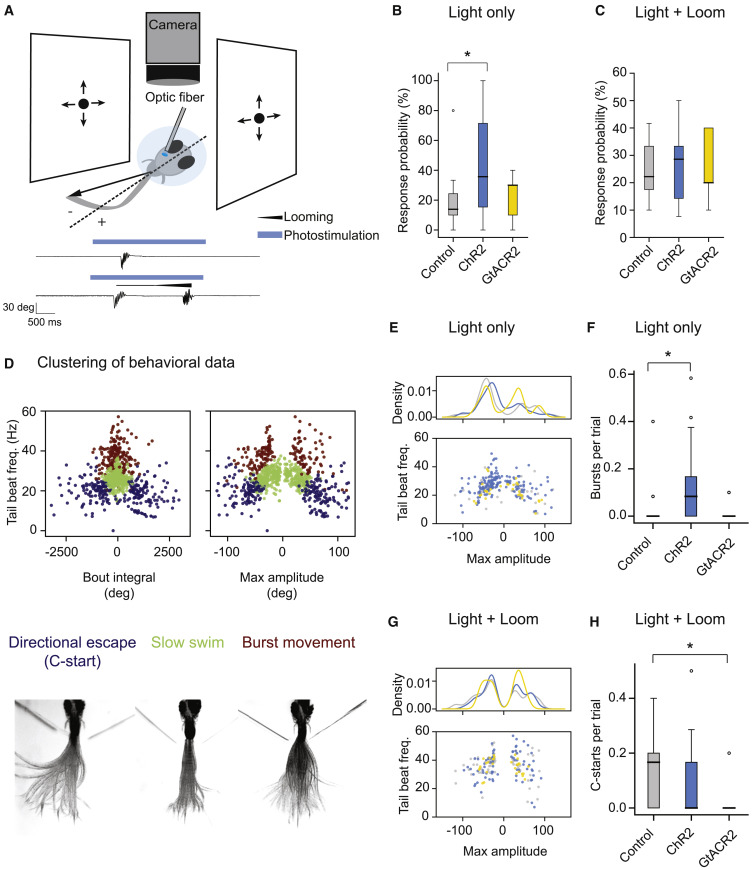
Fig. 4 (A) Schematic of the optogenetics setup. A fish is embedded in agarose with the tail free. The tail is recorded with a camera. Equal looming stimuli are presented to both eyes simultaneously. NI is stimulated unilaterally with an optical fiber. Negative angles represent tail deflections toward the stimulated side, and positive angles represent tail deflections away from the stimulated side. Bottom: example trials from a fish expressing ChR2 in the NI. Shown are photostimulation only (top) and photostimulation with looms (bottom). Black traces show tail angle over time. The blue bar represents time of optogenetic stimulation. The black line above the tail trace triangle represents the duration of loom. (B) Probability that fish perform a swim bout in response to photostimulation under control (gray), ChR2+ (blue), and GtACR2+ (yellow) conditions. ChR2 and GtACR2 animals express ChR2-mCherry or GtACR2-YFP in excitatory lhx9-positive cells of the NI. Control animals express no optogenetic actuator. (C) Probability that fish perform a swim bout when simultaneously presented with looming stimuli to each eye and the NI is stimulated unilaterally. (D) Hierarchical clustering of swim bouts. Identified types are directional C-start escapes (blue), slow swims (green), and burst swims (red). Bottom: overlay of frames from representative bouts belonging to each of the three clusters. (E) Tail beat frequency plotted against maximum tail amplitude for light-evoked bouts across all conditions. Density indicates the KDE over the maximum amplitude. Bouts evoked in ChR2+ fish (blue) are of lower amplitude compared with controls (p = 0.043, Kolmogorov-Smirnov test). (F) Average number of burst swims evoked per trial in response to light stimulation across fish. (G) As in (E) except for bouts evoked by presentation of equal looms to the two eyes during optogenetic stimulation. Distributions are not significantly different between control and optogenetic conditions (p > 0.05, Kolmogorov-Smirnov test). (H) Average number of C-starts (WTA responses) evoked per trial in response to equal looms presented to the two eyes during simultaneous stimulation of the NI across fish. Control fish, n = 18; ChR2+, n = 21; GtACR2+, n = 9.