
|
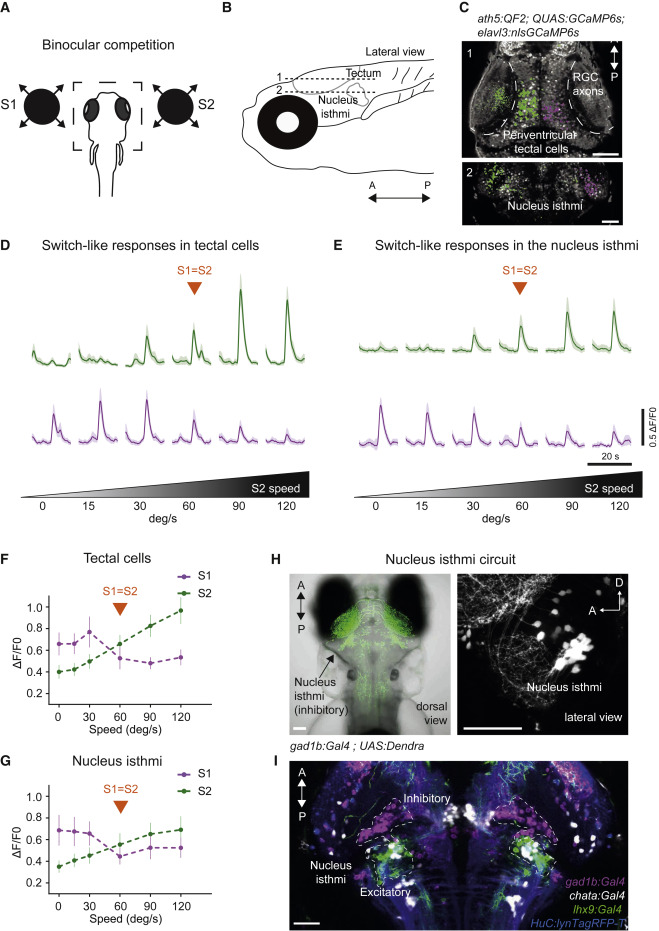
Fig. 3 (A) Binocular competition task. (B) Anatomical location of the tectum (plane 1) and the NI (plane 2). (C) Pixel-wise regression analysis during a single imaging trial. The t-statistic for each pixel is calculated as in Figure 2D. Map 1 shows associated S1-responsive tectal pixels suppressed by a stronger S2 stimulus (in magenta). Pixels that enhance their response as a function of S2 intensity are shown in green. Map 2: similar to Map 1 but for the NI. Scale bars, 50 μm. (D) Characteristic activity profiles for tectal cells. Top traces, average of 10 tectal ROIs enhanced by S2 (green). Lower traces, average of 10 tectal ROIs suppressed by a stronger S2 stimulus (magenta). (E) Similar to (D) but for NI. (F) Summary plot across all conditions for tectal pixels. Switch-like responses, showing pixels suppressed by S2, are shown in magenta. Pixels enhanced by S2 are shown in green. n = 5 fish. (G) Similar to (F) but for NI. n = 4 fish. Error bars indicate SD. (H) Dorsal image of a double-transgenic gad1b:Gal4VP16mpn155; UAS:Dendra-krass1998t fish, labeling GABAergic neurons in green. The arrow indicates the location of GABAergic NI neurons. Right panel, lateral view of gad1b:Gal4VP16mpn155; UAS:nfsb-mCherryc264 fish, labeling GABAergic neurons in white. (I) Alignment of several transgenic lines: gad1b:Gal4VP16mpn155 labeling GABAergic NI neurons (magenta), lhx9:Gal4VP16mpn203 labeling lhx9-positive NI neurons (green), and chata:Gal4VP16mpn202 labeling cholinergic NI neurons (white). elavl3:lyn-tagRFPmpn404 is used as a reference channel (blue). Scale bars, 50 μm.