
|
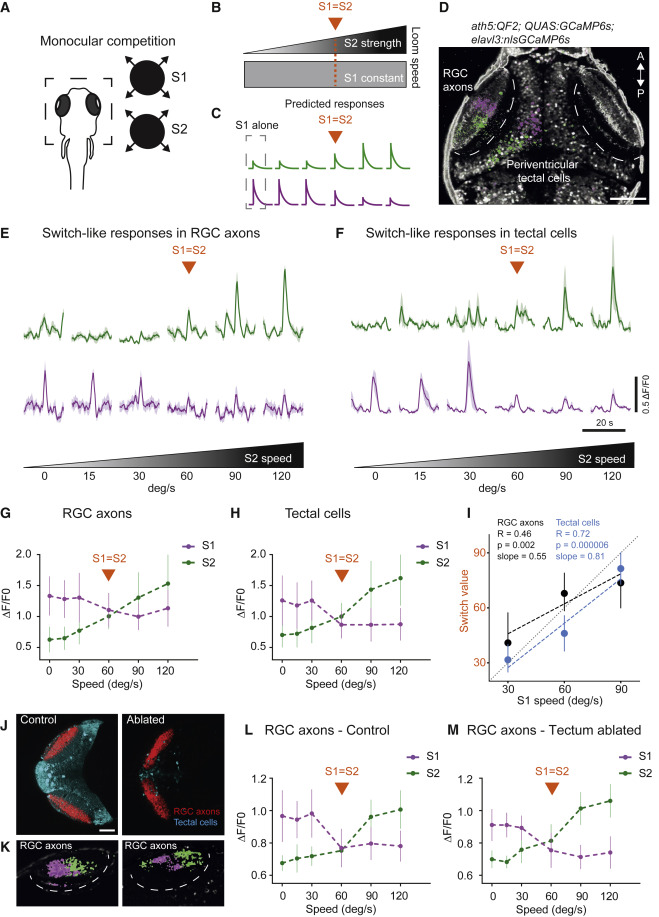
Fig. 2 (A) Schematic of the calcium imaging experiment. Right: monocular competition task. S1, stimulus 1; S2, stimulus 2. (B) Schematic of the competition protocol. The orange line represents the condition with presentation of equal stimuli (switch value). (C) Predicted responses following a strategy resembling WTA. (D) Pixel-wise regression analysis of the temporal series during a single imaging trial. The corresponding t-statistic for each pixel is calculated (only pixels that passed a threshold using the 90th percentile are shown). Map shows associated S1-responsive pixels suppressed by a stronger S2 (magenta) and pixels with enhanced responses as a function of S2 strength (green). Scale bar, 50 μm. (E) Characteristic activity profiles for RGCs. Top traces, average of 10 RGC axon regions of interest (ROIs) enhanced by S2 (in green). Lower traces, average of 10 RGC axon ROIs suppressed by a stronger S2 (in magenta). The orange arrow represents the condition with presentation of equal stimuli (switch value). (F) Similar to (E) but for tectal cells. (G) Summary plot across all conditions for RGC axon pixels. Switch-like responses, showing RGC pixels suppressed by S2, are shown in magenta. RGC pixels enhanced by S2 are shown in green. The S1 expansion rate is 60°/s. (H) Similar to (G) but for tectal pixels. (I) Switch value increases with S1 strength for RGC axons and tectal cells. The R value is the correlation coefficient. The p value relates to testing whether the slope is zero. n = 5 fish. (J) Chemogenetic ablation of tectal cells does not affect suppression observed in RGC axons. The genotype used were ath5:QF2, QUAS:GCaMP6s (red), SAGFF(LF)81C, and UAS:NTR-mCherry (cyan). Left: control fish. Right: ablated fish. Scale bar: 100 μm. (K) Pixel-wise regression analysis of the temporal series during a single imaging trial. The corresponding t-statistic for each pixel is calculated as in (D). The map shows associated S1-responsive pixels suppressed by a stronger S2 (magenta) and pixels that enhance their responses as a function of S2 strength (green). Left panel: control fish. Right panel: ablated fish. (L) Summary plot across all conditions for RGC axon pixels. Switch-like responses, showing RGC pixels suppressed by S2, are shown in magenta. RGC pixels enhanced by S2 are shown in green. The S1 expansion rate is 60°/s. Control fish. n = 4 fish. (M) Similar to (L) but for ablated fish. n = 5 fish. Error bars indicate SD.