
|
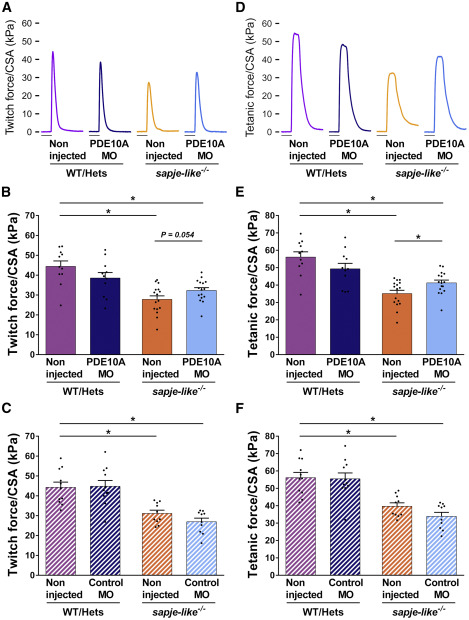
Fig. 5 Increase in Specific Force Produced by pde10a Morphant Dystrophin-Deficient Zebrafish Pairs of sapje-like+/− zebrafish were mated and pde10a morpholino or standard control morpholino (negative control) was injected in one-cell-stage progeny embryos. At 4 dpf, a birefringence assay was performed and unaffected larvae (normal muscle birefringence phenotype) as well as affected larvae (abnormal muscle birefringence phenotype) were sorted. At 6–7 dpf, twitch and tetanic force were measured in the tails and normalized to the cross-section area (CSA). In each experiment, morphant zebrafish were compared to non-injected siblings. At the end of the experiment, fish were collected and genotyped. (A and D) Representative twitch (A) and tetanic force signal (D) are shown. Scale bars represent 50 ms. (B and C) Dot plots show twitch force (kPa) in (B) pde10a morpholino experiments and (C) control morpholino experiments. (E and F) Dot plots showing tetanic force (kPa) in (E) pde10a morpholino experiments and (F) control morpholino experiments. Eleven to 16 (n = 11–16) zebrafish per group were analyzed within at least three (N = 3) independent experiments. Statistical differences between groups are presented as follows: ∗p < 0.05 (t test, ±SEM).