
Fig. 8.
- ID
- ZDB-IMAGE-210403-45
- Publication
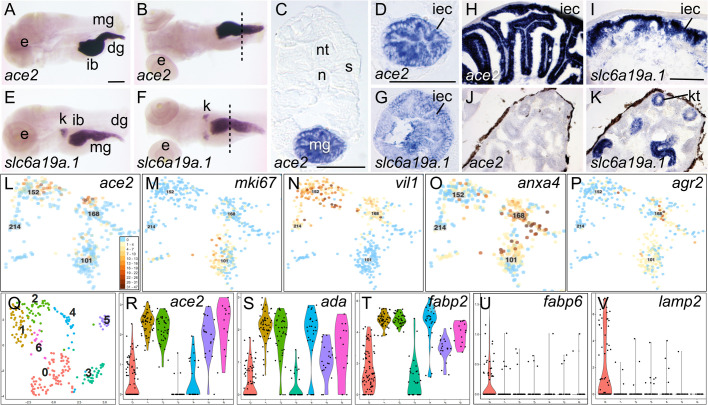
- Postlethwait et al., 2021 - The SARS-CoV-2 receptor and other key components of the Renin-Angiotensin-Aldosterone System related to COVID-19 are expressed in enterocytes in larval zebrafish
- All Figures
- Figures for Postlethwait et al., 2021
|
Fig. 8.