
Fig. 1.
- ID
- ZDB-IMAGE-210403-38
- Publication
- Postlethwait et al., 2021 - The SARS-CoV-2 receptor and other key components of the Renin-Angiotensin-Aldosterone System related to COVID-19 are expressed in enterocytes in larval zebrafish
- All Figures
- Figures for Postlethwait et al., 2021
|
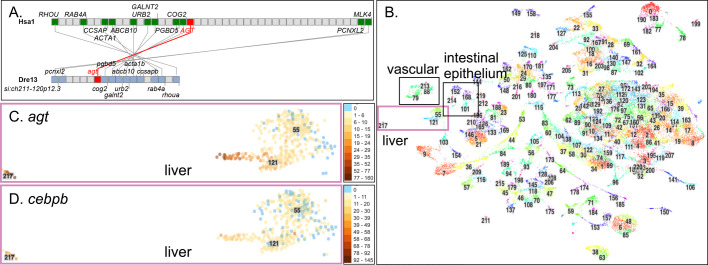
Fig. 1. (A) The section of H. sapiens chromosome 1 (Hsa1) that contains AGT is conserved with the segment of D. rerio chromosome 13 (Dre13) that contains agt. (B) The 220 clusters from the zebrafish scRNA-seq Atlas (Farnsworth et al., 2020). Boxes indicate the liver, vascular endothelium, and intestinal epithelium clusters. (C) Cells in hepatocyte clusters c217, c121, and c121 express agt. Each dot represents a cell. Color intensity indicates expression level according to the scale at the right [the number of Unique Molecular Identifiers (UMIs; unique reads) in each individual cell that mapped to the gene of interest]. Blue cells are not expressing. (D) Expression of the Agt-regulator cebpb in larval liver cells.