IMAGE

FIGURE 6

ID
ZDB-IMAGE-210403-15
Source
Figures for Moreau et al., 2021
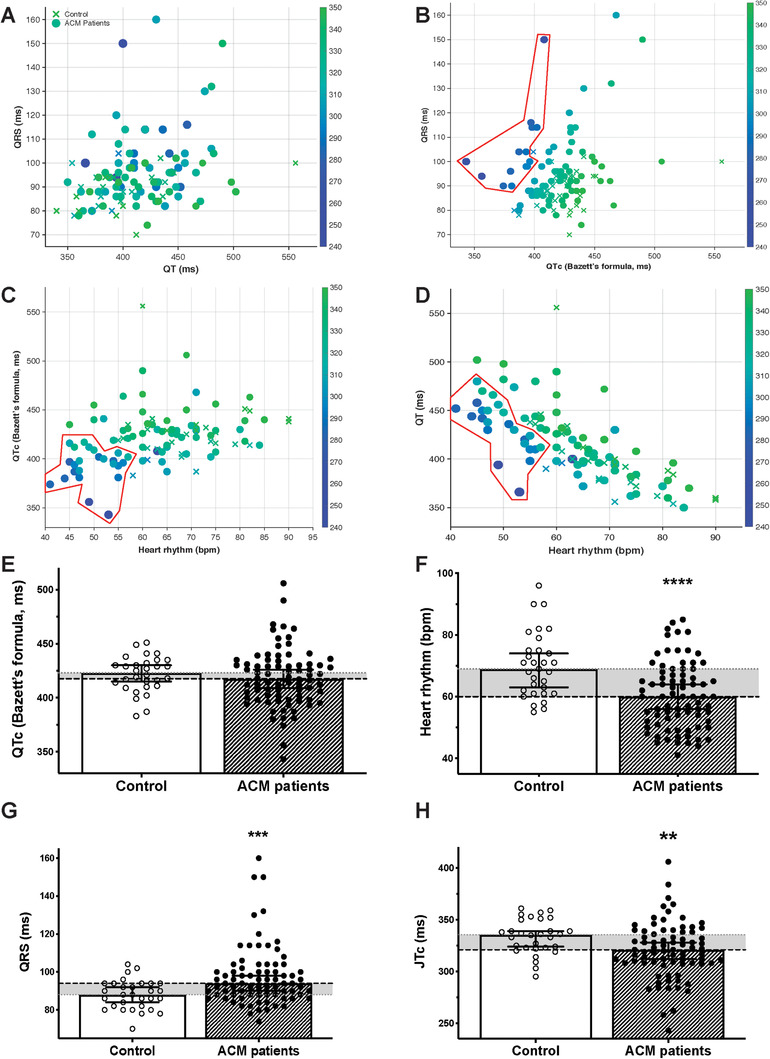
Image
Figure Caption

FIGURE 6

ECG parameters of an ACM cohort. ECG parameters and interdependence in a cohort of control (N = 30) versus ACM (N = 79) individuals, regardless of their age, genetic variation or treatments. (A–D) Control individuals are represented as crosses and ACM patients as circles. The symbols size (bigger symbols if JTc is longer) and colour both rely on the JTc duration (ms, colour scale indicated on the right of each plot). (A) The QRS duration is plotted as a function of the QT duration. (B) The QRS duration is plotted as a function of the QTc duration (Bazett's formula corrected). (C) The QTc duration (Bazett's formula corrected) is plotted as a function of the heart rate. (D) The QT duration is plotted as a function of the heart rate. (E–H) Recapitulative histograms depicting the control and ACM patient's ECG parameters: the QTc duration (Bazett's formula corrected) (E), the heart rhythm (F), the QRS duration (G) and the JTc duration (H). Histograms represent the median (95% confidence interval). The horizontal grey area illustrates the difference between the control and the patient parameters. *p < 0.05, **p < 0.01, and ****p < 0.0001 (Mann–Whitney test)

Acknowledgments
This image is the copyrighted work of the attributed author or publisher, and ZFIN has permission only to display this image to its users. Additional permissions should be obtained from the applicable author or publisher of the image. Full text @ Clin Transl Med