IMAGE

FIGURE 5

ID
ZDB-IMAGE-210403-13
Source
Figures for Moreau et al., 2021
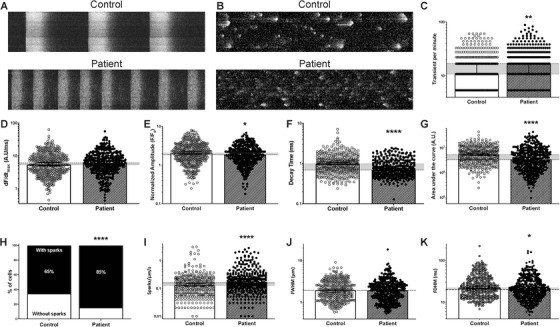
Image
Figure Caption

FIGURE 5

Spontaneous calcium dynamics of control and patient‐specific hiPSC‐CM. (A) Typical line‐scan confocal images (5000 lines, 1.24 ms/line, 1 × 512 pixels) of calcium transients in Fluo‐4 non‐ratiometric fluorescent probe‐loaded control (top) and patient‐specific (bottom) hiPSC‐CM. (B) The global transient activity was removed from the original image to keep only diastolic Ca2+ activity (sparks). (C–K). Both the Ca2+ transient activity (control N = 325 cells; patient N = 357 cells) and the sparks (control N = 362 cells; patient N = 373 cells) were studied: transient per minutes (C), maximum rising fluorescence slope (D), normalised amplitude (E), transient decay duration (F), area under the curve (G), the percentage of cells with Ca2+ sparks (control: 65% (362 out of 553); patient specific: 85% (373 out of 441)) (H), in each cell with sparks, their frequency (I), sparks full width at half maximum (J) and sparks full duration half maximum (K). Histograms represent the median (95% confidence interval). The horizontal grey area illustrates the difference between the control and the patient specific conditions. *p < 0.05 and ****p < 0.0001 (Mann–Whitney test, except for (H) where Fisher's exact test was used)

Acknowledgments
This image is the copyrighted work of the attributed author or publisher, and ZFIN has permission only to display this image to its users. Additional permissions should be obtained from the applicable author or publisher of the image. Full text @ Clin Transl Med