
|
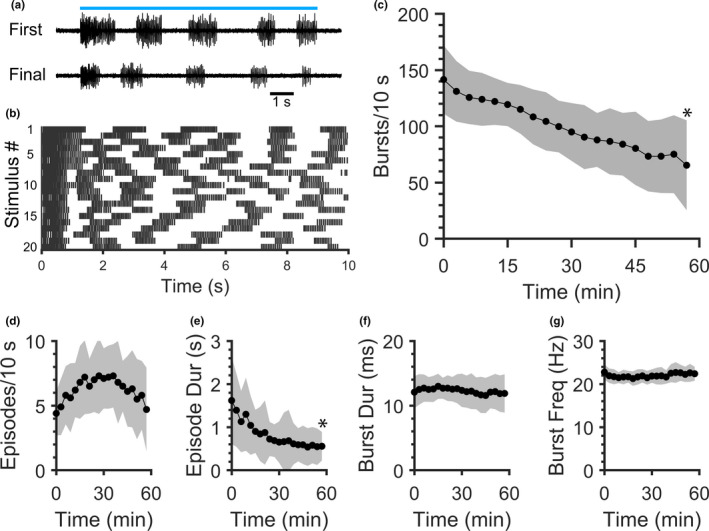
FIGURE 2
Robustness of ChR2‐induced fictive swimming decreases during repetitive blue light stimulation. Peripheral motor nerve voltage traces were recorded as 20 blue light stimuli were delivered at 3 min intervals. (a) Peripheral nerve voltage traces from a representative preparation during the first (t = 0) and final (t = 57 min) blue light stimuli (blue line represents continuous 10 s blue light stimulus). (b) Raster plot of burst times (vertical lines) for each of the 20 stimuli (rows) delivered to the preparation in (a). (c–g) Mean values of fictive swimming properties during repetitive 10 s stimuli: number of bursts produced during each stimulus (c), number of episodes produced during each stimulus (d), episode duration (e), burst duration (f), and within‐episode burst frequency (g). Shaded regions represent SD. Asterisks indicate significant differences between the first and final (20th) stimuli.