
|
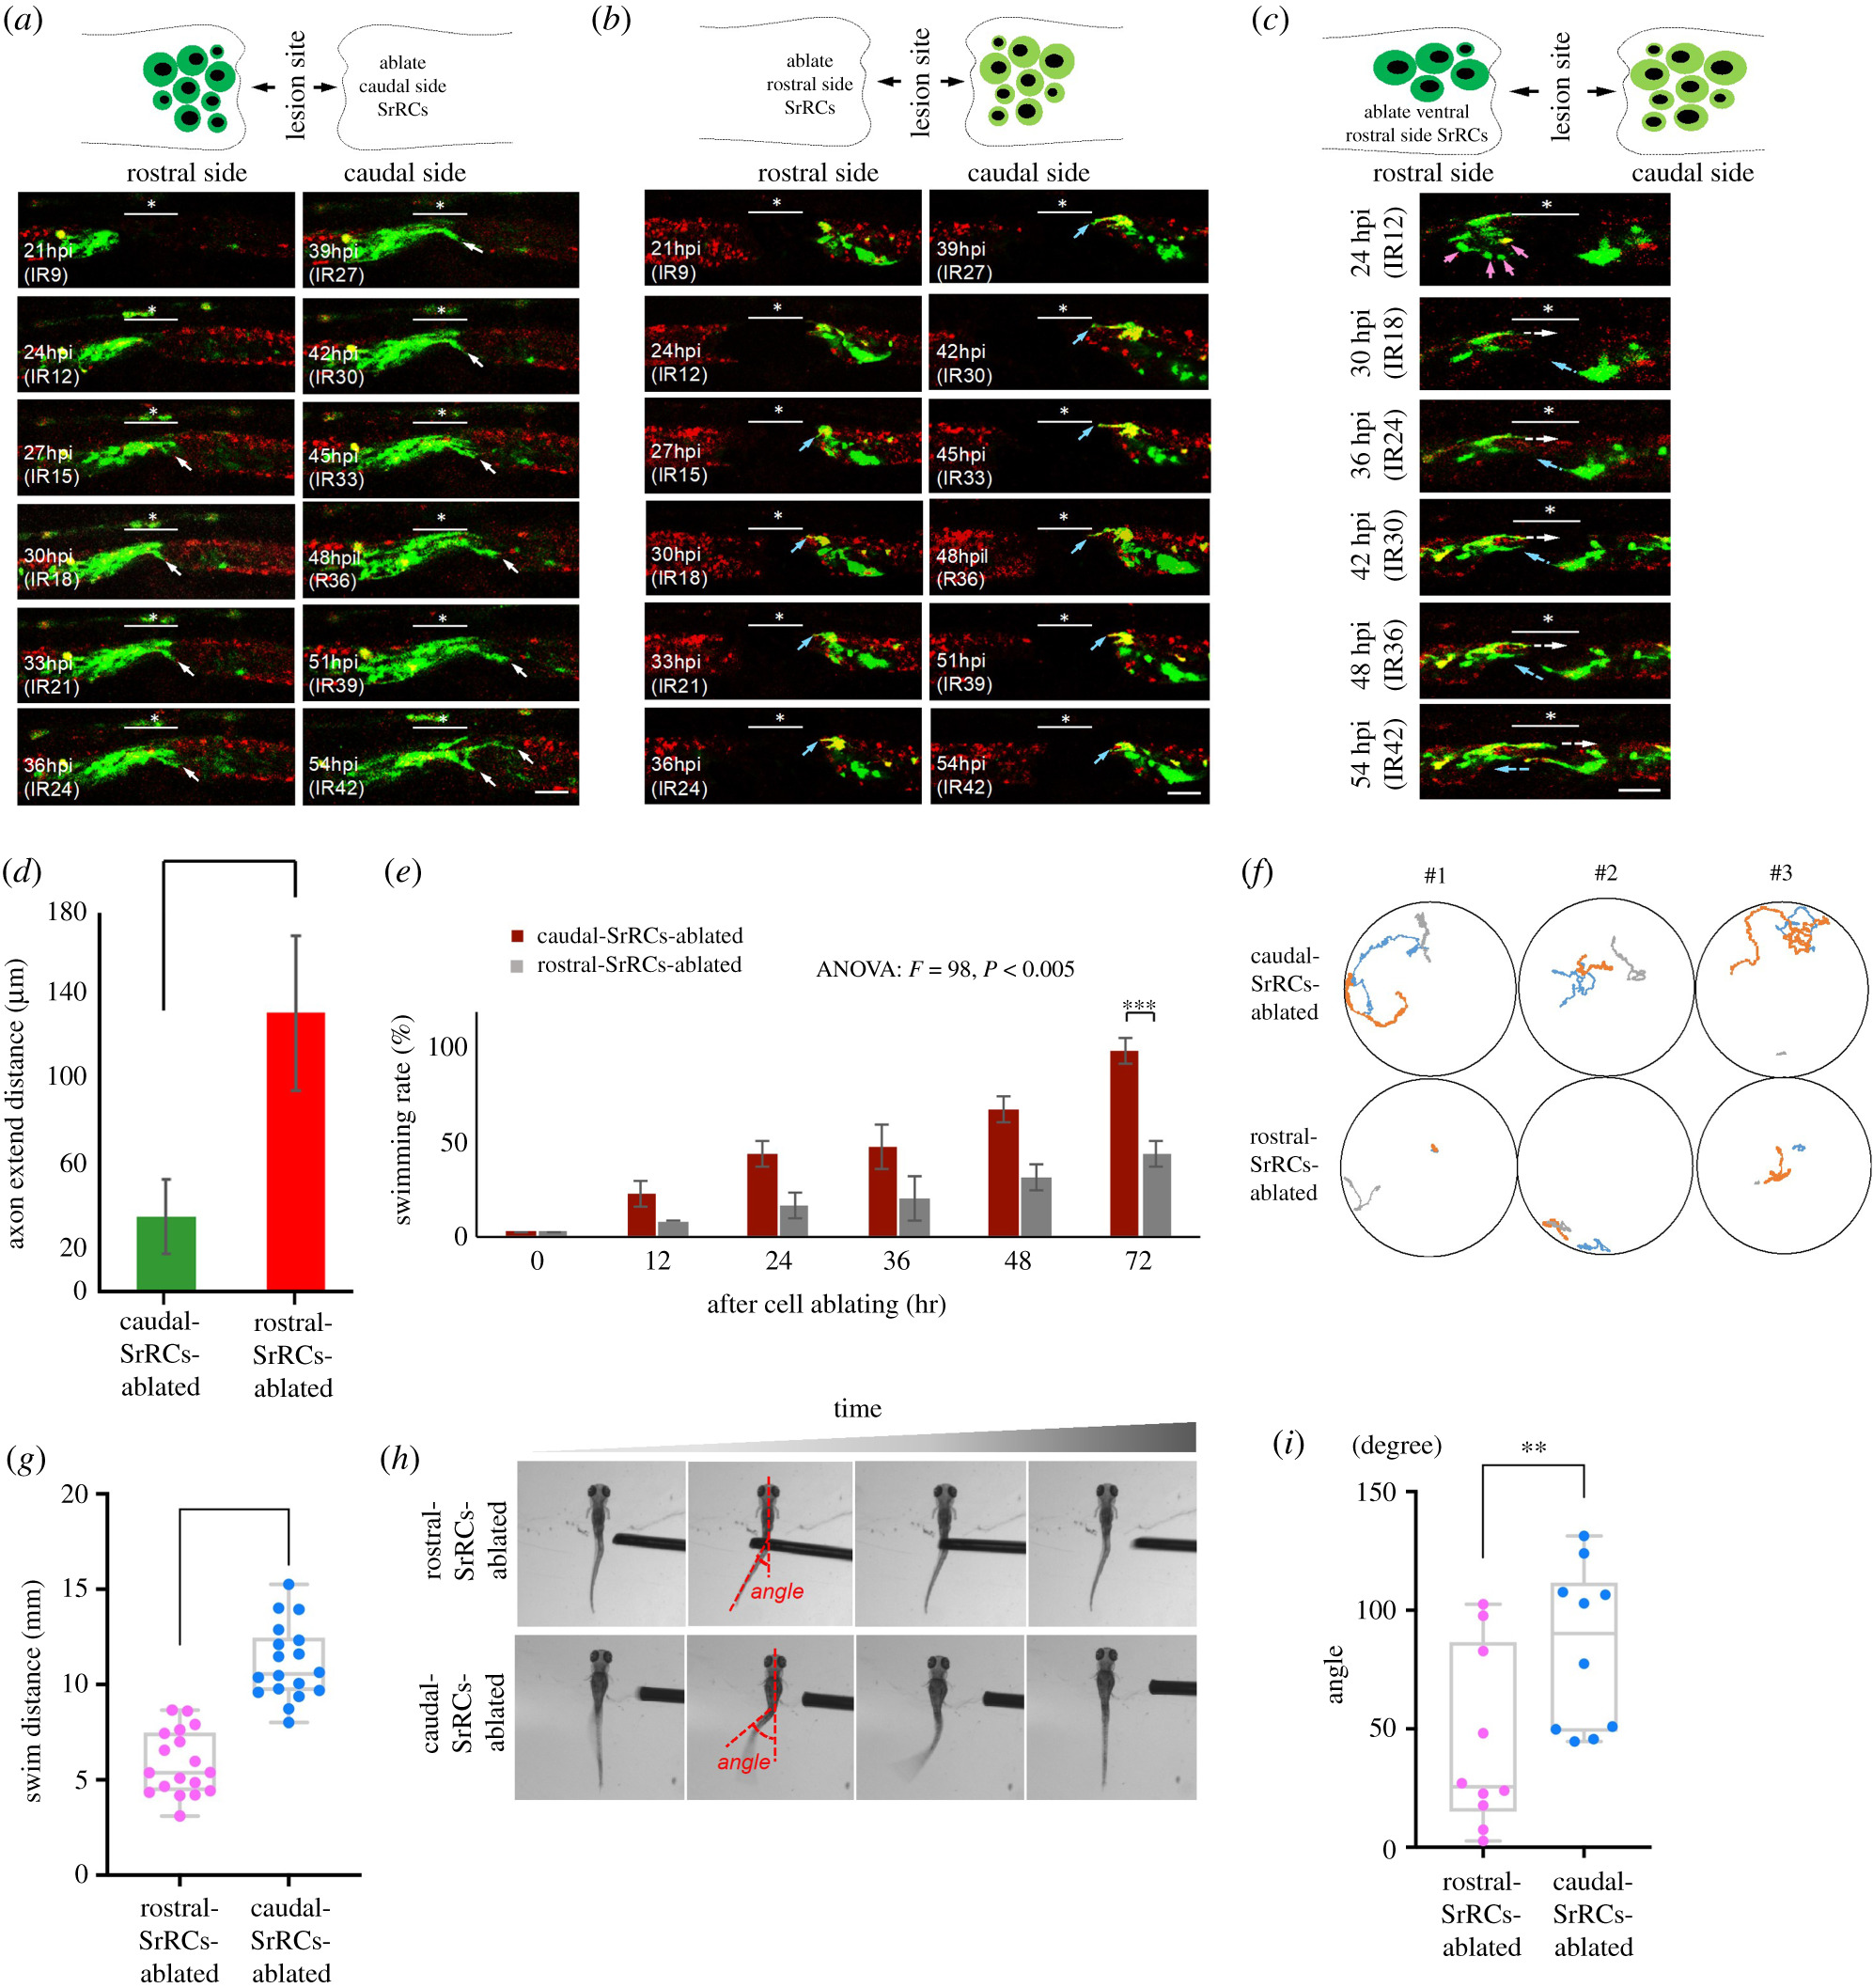
Fig. 3 Rostral-SrRCs in the spinal cord of SCI-treated zebrafish larvae can prominently enhance functional recovery during neuronal regeneration. Double-transgenic embryos derived from transgenic line Tg(huc-dsRed), crossed with line huORFZ, were used to trace neural differentiation and regeneration following SCI by confocal time-lapse photography. (a–c) The underscore stars indicate the SCI sites, while white arrows point to cells differentiated into neurons and their extended axons. Dynamic traces of neural differentiation and regeneration of SCI-treated larvae upon termination of IR-Laser ablation (IR) for serial hours, as indicated, when (a) caudal-SrRCs, (b) rostral-SrRCs and (c) rostral-SrRCs on the ventral side were ablated. (d) Statistical analysis of the average of the axonal extended distance (μm) obtained from 10 larvae in each group after IR-laser ablation of caudal- or rostral-SrRCs of SCI-larvae. Unpaired t-test was used to perform statistical analysis of significant difference between two groups (***p < 0.001). (e) Statistical analysis of swimming recovery rates of SCI-treated larvae upon termination of IR-Laser treatment at IR0 (starting time) through IR72 (t-test: ***p < 0.001). (f) Using a high-speed camera system to capture the swimming route of SrRCs-ablated SCI-larvae at IR72. Numbers #1, #2 and #3 indicate three individuals out of six larvae in each group. Each one was recorded three times (as also referenced in electronic supplementary material, figure S7). (g) Comparison of swimming distance of larvae between two groups. Swimming distance (mm) was represented as overall mean for each group calculated from the total mean of 18 larvae. The average value for each larva was based on three independent trials. (Two-way ANOVA with Bonferroni multiple comparisons test, ***p < 0.005; t-test: ***p < 0.001). (h) After touch-evoked response, photos were taken to calculate C-band angle, which was the angle between the centre of gravity and the tail. (i) Statistical analysis of the overall average of the C-bend degrees calculated from 10 larvae in each group. Unpaired t-test showed that degree was significantly different between these two groups (**p < 0.01). Error bars indicate s.e.m.