IMAGE

FIGURE 2

ID
ZDB-IMAGE-210328-7
Source
Figures for Czimer et al., 2021
Image
Figure Caption

FIGURE 2

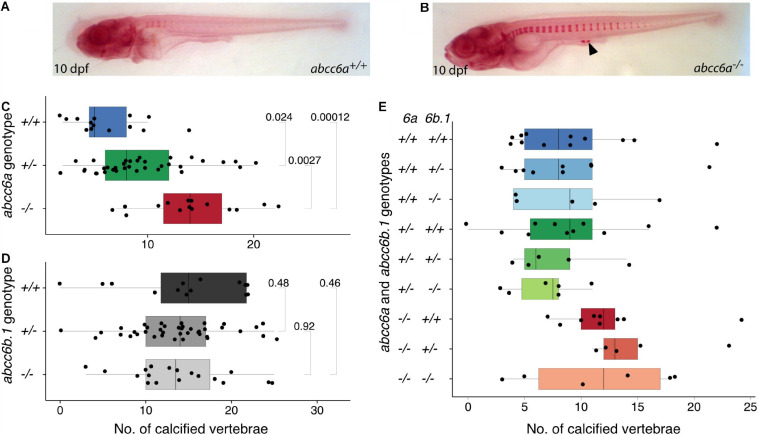
Calcification in single and double mutants of zebrafish ABCC6 paralogs. (A,B) Alizarin Red stained 10 dpf abcc6a+/+ and abcc6a–/– larvae. Ectopic calcification loci in mutants are denoted with arrowhead. (C) Quantification of calcified vertebrae in the 10 dpf progeny of abcc6a+/– carriers, plotted by genotype. The results show a significant increase in the rate of calcification in the abcc6 mutants compared to their siblings (n = 65, significance levels calculated with Mann-Whitney test). (D) Quantification of calcified vertebrae in the 14 dpf progeny of abcc6b.1+/– carriers, plotted by genotype. Results suggests that impairment of abcc6b.1 does not affect the rate of vertebral calcification (n = 72, significance levels calculated with Mann-Whitney test). (E) Quantification of calcified vertebrae in the 14 dpf progeny of abcc6a+/–;abcc6b.1+/– carriers, plotted by genotype (n = 68).

Figure Data
Acknowledgments
This image is the copyrighted work of the attributed author or publisher, and ZFIN has permission only to display this image to its users. Additional permissions should be obtained from the applicable author or publisher of the image. Full text @ Front Cell Dev Biol