
|
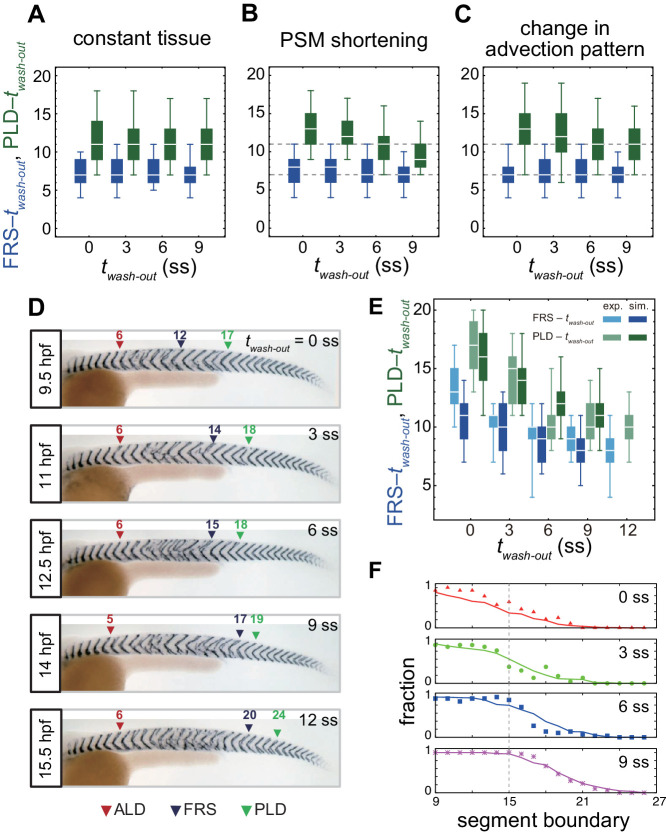
Figure 4 (A-C) Dependence of times to FRS and PLD on DAPT washout time for different conditions in simulations. (A) Constant tissue where all the tissue parameters remain unchanged during a simulation. (B) PSM length becomes shorter with time. All the other parameters are constant. See also Figure 4—video 1. (C) Cell advection pattern changes at 9 somite stage (ss). Before 9 ss, the strain rate is larger in the anterior than posterior PSM. After 9 ss, the strain rate becomes larger in the posterior PSM. See also Figure 4—video 2. All the other parameters are constant. The box-whisker plots indicate 5, 25, 75, and 95 percentiles. The white bars mark the median. In (B) and (C), the gray dotted lines mark the medians of FRS and PLD in the constant tissue shown in (A). (D) Whole-mount in situ hybridization for the myotome segment boundary marker gene xirp2a in ~36 hr post-fertilization (hpf) embryos. DAPT washout time is 9.5 hpf (0 ss; n = 28), 11 hpf (3 ss; n = 22), 12.5 hpf (6 ss; n = 28), 14 hpf (9 ss; n = 30), and 15.5 hpf (12 ss; n = 26) from top to bottom. Red, blue and green triangles indicate the ALD, FRS, and PLD, respectively. (E) Dependence of times to FRS and PLD on DAPT washout time. Light blue and green box-whisker plots indicate 5, 25, 75, and 95 percentiles for embryonic experimental data (exp.). Dark blue and green box-whisker plots indicate those for simulation data (sim.). The white bars mark the median. The PSM shortening, change in cell advection pattern and increase in the coupling strength are combined in the model, see also Figure 4—videos 3 and 4. The lack of information about the formation of final segments in embryos precludes simulations for the latest washout (12 ss), see the text. (F) Spatial distribution of segment boundary defects. Symbols indicate embryonic experimental data and lines indicate simulation data. Grey dashed vertical line across panels is a guide to the eye. In (A-C), (E), results of 100 realizations of simulations with each washout timing are plotted. Parameter values for numerical simulations are listed in Supplementary files 1 and 2. Source data for (D-F) is available in Figure 1—source data 1.