
|
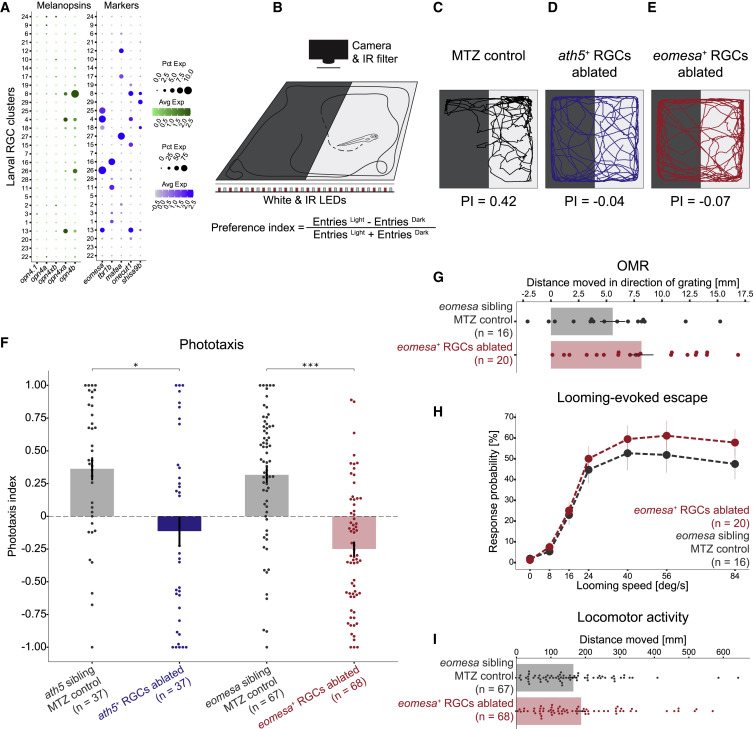
Fig. 7 (A) Dot plots showing type-specific expression of melanopsin in larval RGCs. Left: of five melanopsin homologs (columns), only opn4xa and opn4b have discernible expression in specific larval RGC clusters (rows). Right: opn4xa+ and opn4b+ clusters include eomesa+ RGC types, but not mafaa+ or tbr1b+ types. An opn+eomesa- RGC type is marked by the co-expression of onecut1 and shisa9b. Larval clusters are ordered as in Figure 3A. Expression patterns are conserved in adult RGC types (Figure S7D). (B) Phototaxis assay. Larvae are placed in a light-dark choice arena, and their positions are tracked over time. A phototaxis index (PI) quantifies attraction toward the light source. (C–E) Representative traces and PI values of an MTZ-treated control larva (C), ath5+ RGC-ablated blind larva (D), and eomesa+ RGC-ablated larva (E). (F) PI values for NTR- Tg(ath5:QF2) and Tg(eomesa:QF2) control siblings as well as ath5+ RGC ablated blind fish, and eomesa+ RGC-ablated larvae. Shown is a bar plot with a superimposed dot plot, where each dot represents one fish. Error bars represent SEM. ∗p < 0.05, ∗∗∗p < 0.001 (Dunn post hoc test). (G) Quantification of optomotor response in MTZ-treated controls and eomesa+ RGC-ablated larvae, plotted as in (F). (H) Escape probability of MTZ-treated controls and eomesa+ RGC-ablated larvae to a looming disc. Each dot represents the mean value at a given stimulus expansion rate. Error bars represent SEM. (I) Quantification of locomotor activity of MTZ-treated controls and eomesa+ RGC-ablated larvae, plotted as in (F).