
|
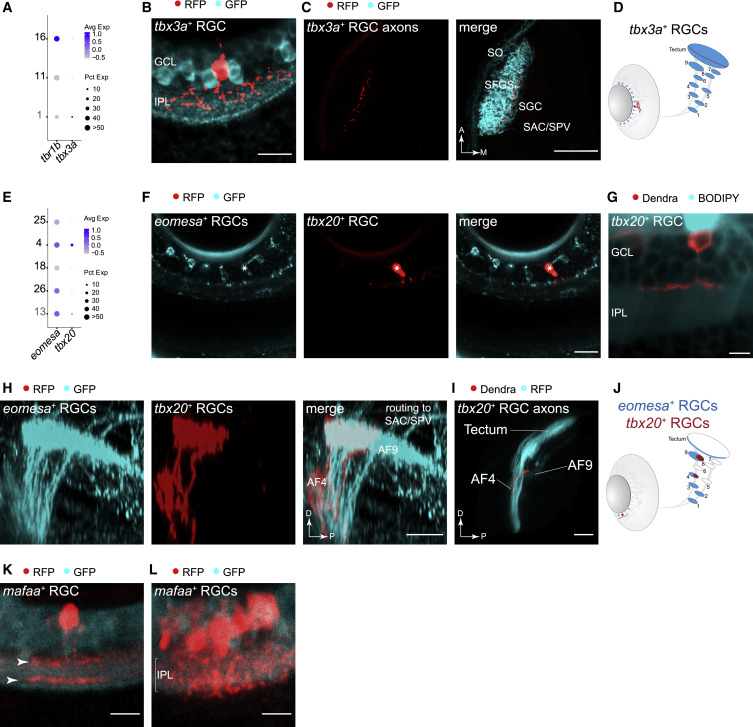
Fig. 5 (A) Dot plot showing selective co-expression of tbx3a in larval tbr1b+ cluster 1. (B) Immunostained retina of a Tg(tbx3a:QF2, QUAS:switchNTR, ath5:Cre, isl2b:GFP) larva shows diffuse dendrites of tbx3a+ RGCs in the IPL. GCL, ganglion cell layer; IPL, inner plexiform layer. Scale bar, 10 μm. (C) Confocal plane of a live Tg(tbx3a:QF2, QUAS:switchNTR, ath5:Cre, isl2b:GFP) larva shows tbx3a+ RGC axons terminating in a deep SFGS layer. A, anterior; M, medial. Scale bar, 50 μm. (D) Schematic representation of the soma distribution and projection patterns of the RGC type labeled by tbx3a (red) against all RGCs (blue). (E) Dot plot showing specific expression of tbx20 in larval eomesa+ cluster 4. (F) Immunostained retinal section of a quadruple-transgenic Tg(eomesa:QF2, QUAS:GFP, tbx20:Gal4, UAS:NTR-mCherry) larva showing GFP-labeled eomesa+ RGCs (left), one of which also expresses tbx20+ based on RFP-staining (right, star indicates the co-labeled cell). Scale bar, 20 μm. (G) Confocal plane of a live Tg(tbx20:Gal4, UAS:Dendra) larval retina with a BODIPY neuropil counterstain shows tbx20+ RGCs exhibiting monostratified dendrites in the ON sublayer of the IPL. Scale bar, 5 μm. (H) Confocal image of GFP-immunostained eomesa+ RGC axons and RFP-immunostained eomesa+tbx20+ RGC axons, innervating AF4 and AF9. D, dorsal; P, posterior. Scale bar, 20 μm. (I) 3D side view of the optic tract imaged in a live Tg(tbx20:Gal4, UAS:Dendra, isl2b:tagRFP) larva, showing that tbx20+ RGC axons innervate AF4 and terminate in AF9. D, dorsal; P, posterior. Scale bar, 50 μm. (J) Schematic of soma distribution and axon projections of the RGC type labeled by tbx20 (red) against all eomesa+ RGCs (blue). (K) Single mafaa+ RGC in the periphery of the immunostained retina with bistratified dendrite (arrowheads) in the IPL. This stratification pattern matches the B2 morphology (Robles et al., 2014). (L) Dense cluster of immunostained mafaa+ RGCs in the SZ with dendritic arborizations that extend throughout the width of the IPL (indicated by bracket). Some mafaa+ RGCs appear to have D1 morphology (Robles et al., 2014).