
|
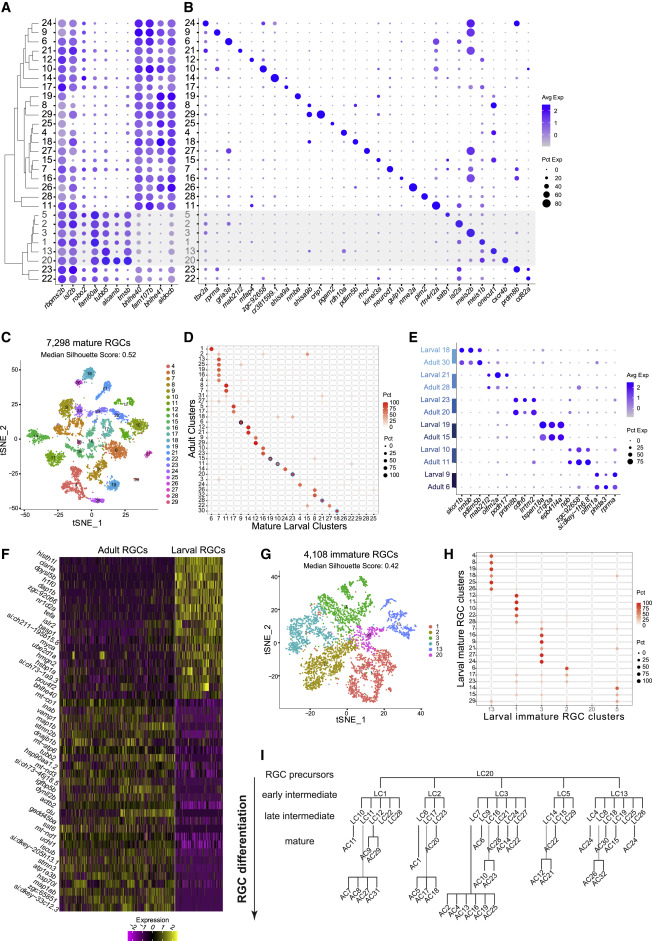
Fig. 3 (A) Global transcriptional relatedness (dendrogram, left) of larval RGC clusters (rows) identifies two groups, corresponding to mature and immature RGCs (gray cluster labels and shaded horizontal bar). The dot plot highlights expression of pan-RGC markers rbpms2b, isl2b, and robo2, as well as the top differentially expressed genes (n = 8) between immature and mature RGC clusters. (B) Expression patterns of markers (columns) that are selectively enriched in larval RGC clusters (rows), ordered as in (A). (C) tSNE visualization of 23 mature RGC clusters (colors) comprising 7,298 cells (points). The median silhouette score was computed for each graph. The score ranges from −1 to 1, with higher values indicating tighter cluster boundaries. (D) Transcriptional correspondence between adult and mature larval RGC clusters. Circles and colors indicate the proportional representation of adult cluster identities (rows) in mature larval clusters (column) based on a supervised classification analysis using the xgboost algorithm. Each row is normalized to sum to 100%. Blue circles highlight six instances of a 1:1 corresponding pair of adult and larval clusters, which are separately analyzed in (E)–(G). (E) Dot plot showing shared patterns of gene expression between the six 1:1 cluster pairings selected from the classification model (blue circles in D). Colored bars (left) indicate matching cluster pairs. (F) Heatmap showing differentially expressed genes (rows) between adult and larval stages identified from the six 1:1 matching clusters shown in (D). Columns correspond to individual RGCs grouped by age. Values are row-wise Z-scored gene-expression values. (G) tSNE visualization of 6 immature RGC clusters (colors) comprising 4,108 cells (points). The median silhouette score was computed as in (C). (H) Transcriptional correspondence between mature (rows) and immature (columns) larval RGC clusters using an xgboost classifier trained on immature larval RGCs. Representation is as in (D). (I) Model of RGC type diversification. Larval clusters (LCs) and adult clusters (ACs) are arranged by their transcriptional correspondences shown in (D) and (H). RGC precursors give rise to immature (early intermediate) RGC clusters and mature (late intermediate) larval clusters, which further diversify into mature adult clusters.