
Image
|
Figure Caption
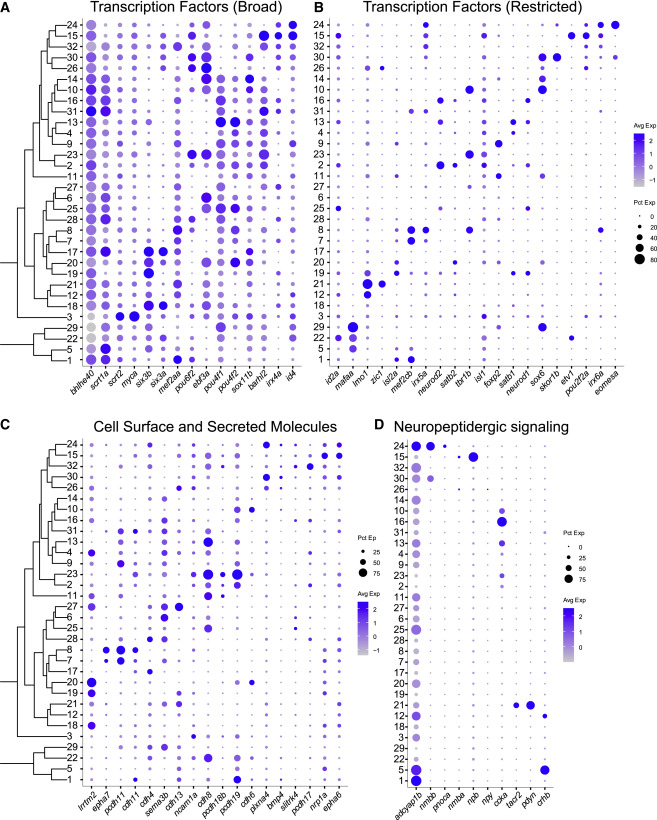
Fig. 2 (A and B) Dot plots highlighting examples of variably expressed TFs in adult RGC clusters, subdivided into broad (A) and restricted (B) categories. Representation is as in Figure 1G. Full list is provided in Table S2. (C) Dot plot highlighting key cell-surface and secreted molecules selectively expressed in adult RGC clusters. (D) Dot plot highlighting neuropeptides selectively expressed in adult RGC clusters.
Acknowledgments
This image is the copyrighted work of the attributed author or publisher, and
ZFIN has permission only to display this image to its users.
Additional permissions should be obtained from the applicable author or publisher of the image.
Full text @ Neuron