
|
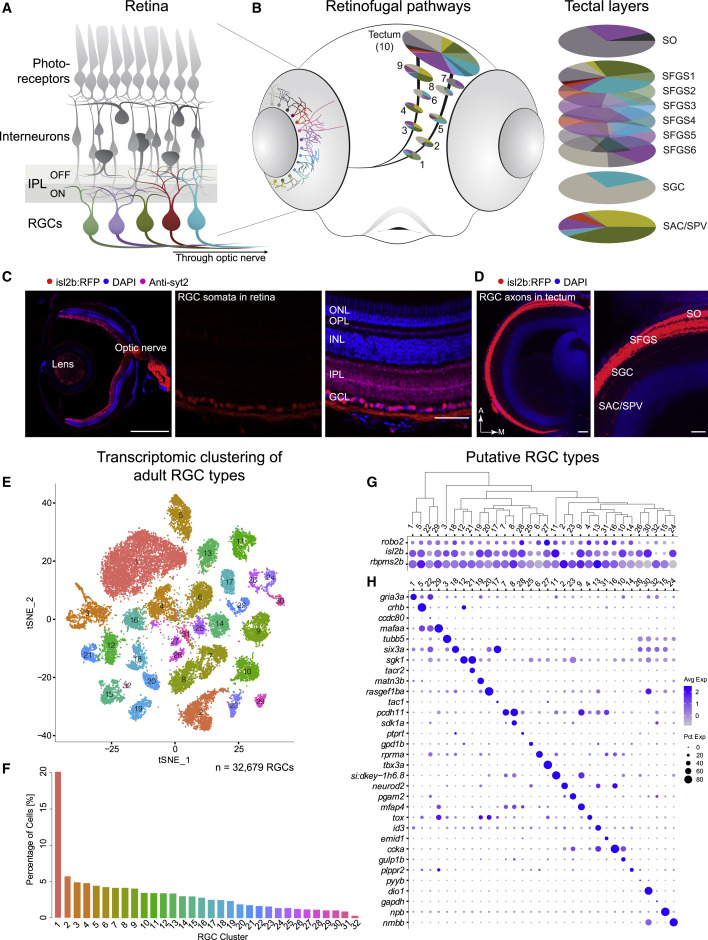
Fig. 1 (A) Sketch of the zebrafish retina. RGCs, the innermost retinal neurons, transmit visual information to the rest of the brain through the optic nerve. Unique patterns of dendritic stratification in the inner plexiform layer (IPL), which is divided into two halves that subserve ON and OFF light responses, enables distinct RGC types (colors) to receive presynaptic input from specific interneuron types, rendering individual RGC types sensitive to distinct visual features. (B) Left: RGC projectome (Robles et al., 2014). RGC types are defined by stereotyped combinations of dendritic stratification patterns in the retina and axonal projections to retinorecipient nuclei, named arborization fields (AFs 1–9) and tectum. Right: within the tectum, RGC axons project to nine or ten laminae, including SO (stratum opticum), SFGS (stratum fibrosum et griseum superficiale) 1–6, SGC (stratum griseum centrale), and the boundary between SAC/SPV (stratum album centrale/stratum periventriculare). Each AF or tectal lamina is innervated by a unique set of RGC morphotypes, depicted by colors. (C) Tg(isl2b:tagRFP) labels RGCs. Left: section of an adult eye immunostained for RFP, synaptotagmin (syt2) as a neuropil stain, and DAPI counterstain of somata. Middle: magnified retinal section highlighting RFP-labeled RGCs. Right: overlay of all markers in the retinal section. ONL, outer nuclear layer; OPL, outer plexiform layer; INL, inner nuclear layer; IPL, inner plexiform layer; GCL, ganglion cell layer. Scale bars, 500 μm (left) and 50 μm (middle and right). (D) Left: confocal plane covering the RFP-immunostained adult Tg(isl2b:tagRFP) tectum with DAPI counterstain. Right: magnified area. A, anterior; M, medial. For layer abbreviations, see (A). Scale bar, 100 μm. (E) t-distributed stochastic neighbor embedding (tSNE) visualization of 32 transcriptional clusters (colors) of 32,679 adult zebrafish RGCs (points). Clusters are numbered in the order of decreasing relative frequency. (F) Relative frequency (y axis) of adult RGC clusters (x axis), ordered from highest to lowest. Clusters are colored as in (E). (G) Dot plot showing the expression patterns of three RGC markers (rows) across adult clusters (columns). The area of each circle depicts the percentage of cells expressing the gene, and the color depicts the Z-scored expression in cells with non-zero transcripts. Clusters are ordered based on their global transcriptional relatedness depicted using a dendrogram (top), computed using hierarchical clustering. (H) Dot plot showing expression patterns of markers (rows) that are selectively enriched in adult RGC clusters (columns). Column ordering and expression depiction were as in (G).