
|
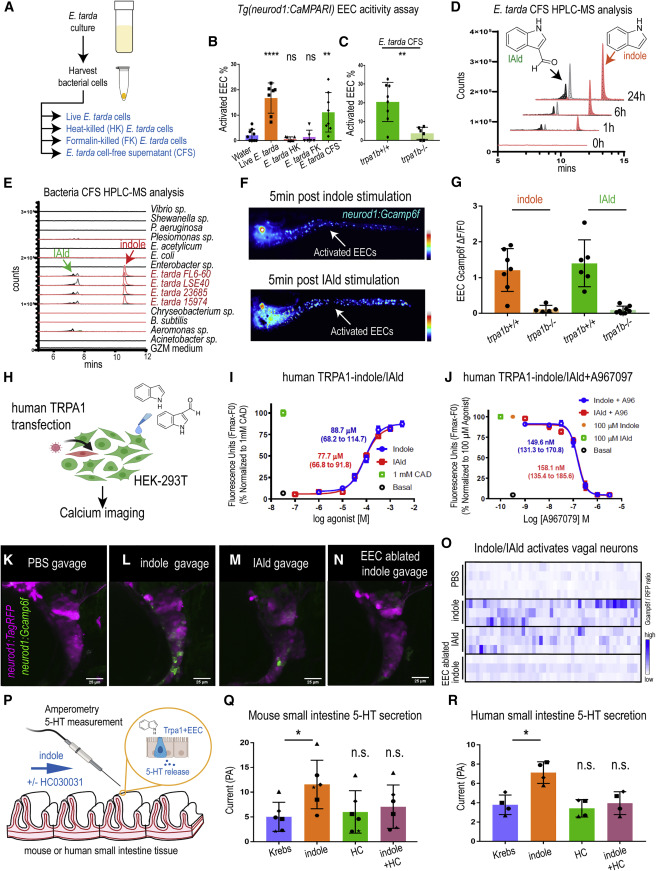
Fig. 7 ure 7. E. tarda derived tryptophan catabolites activate Trpa1 and the EEC-vagal pathway (A) Method for preparing different fractions from E. tarda GZM (zebrafish water) culture. (B) Activated EECs in Tg(neurod1:CaMPARI) zebrafish stimulated by different E. tarda fractions. (C) Activated EECs in trpa1b+/+ and trpa1b−/− Tg(neurod1:CaMPARI) zebrafish stimulated with E. tarda CFS. (D) Screening of supernatants of E. tarda in GZM culture medium by HPLC-MS. Samples were collected at 0, 1, 6, and 24 h. Abbreviations are as follows: IAld, indole-3-carboxaldehyde; and IEt, tryptophol. Extracted ions were selected for IAld (m/z 145), IEt, (m/z 161), and indole (m/z 117). (E) Chemical profiles of Trp-indole derivatives from supernatants of various commensal bacteria in GZM medium for 1 day of cultivation. y axis values represent the production of Trp-indole derivatives normalized to CFU, with each strain beginning at zero. (F) Tg(neurod1:Gcamp6f) zebrafish stimulated by indole or IAld. Activated EECs in the intestine are labeled with white arrows. (G) Quantification of EEC Gcamp activity in trpa1b+/+ and trpa1b−/− zebrafish stimulated with indole or IAld. (H) Schematic of experimental design to test the effects of indole and IAld on human or mouse Trpa1. (I) Dose-response analysis of the integrated Calcium 6 fluorescence response above baseline (Fmax.-F0; maximal change in Ca2+ influx) as a function of indole and IAld concentration in human TRPA1 expressing HEK-293T cells. (EC50 = 88.7 μM, 68.2–114.7 μM 95% CI for indole; and, EC50 = 77.7 μM, 66.8–91.8 μM 95% CI for IAld) Concentration-response data were normalized to 1 mM CAD, a known TRPA1 agonist. Data represent the mean of 3–4 experiments, each performed with 3–4 replicates. (J) Dose-response analysis of A967079 inhibition of indole and IAld-induced Ca2+ influx. (IC50 = 149.6 nM, 131.3–170.8 nM 95% CI for indole; and, IC50 = 158.1 nM, 135.4–185.6 μM 95% CI for IAld) Concentration-response data of A967079 inhibition were normalized to response elicited by 100-μM agonist (indole or IAld). (K–N) In vivo calcium imaging of vagal sensory ganglia in WT (K-M) or EEC-ablated (N) Tg(neurod1:Gcamp6f); Tg(neurod1:TagRFP) zebrafish gavaged with PBS (K), indole (L,N) or IAld (M). (O) Quantification of individual vagal sensory ganglia cell Gcamp6f fluorescence intensities in WT or EEC-ablated zebrafish gavaged with PBS or 1 mM indole. (P) Schematic of amperometric measurements to examine the effects of indole on 5-HT secretion in mouse and human small intestinal tissue. (Q) Indole caused a significant increase in 5-HT secretion in mouse duodenum; however, no such effects were observed in the presence of Trpa1 antagonist HC030031. (R) Indole caused a significant increase in 5-HT secretion in human ileum; however, no such effects were observed in the presence of Trpa1 antagonist HC030031. Data in (B, C, G, Q, and R) are presented as mean ±SD. One-way ANOVA with Tukey’s post-test was used in (B and Q), Student’s t test was used in (C and H) and paired one-way ANOVA with Tukey’s post-test was used in (P–R). ∗p < 0.05; ∗∗p < 0.01; ∗∗∗p < 0.001; ∗∗∗∗p < 0.0001.