
|
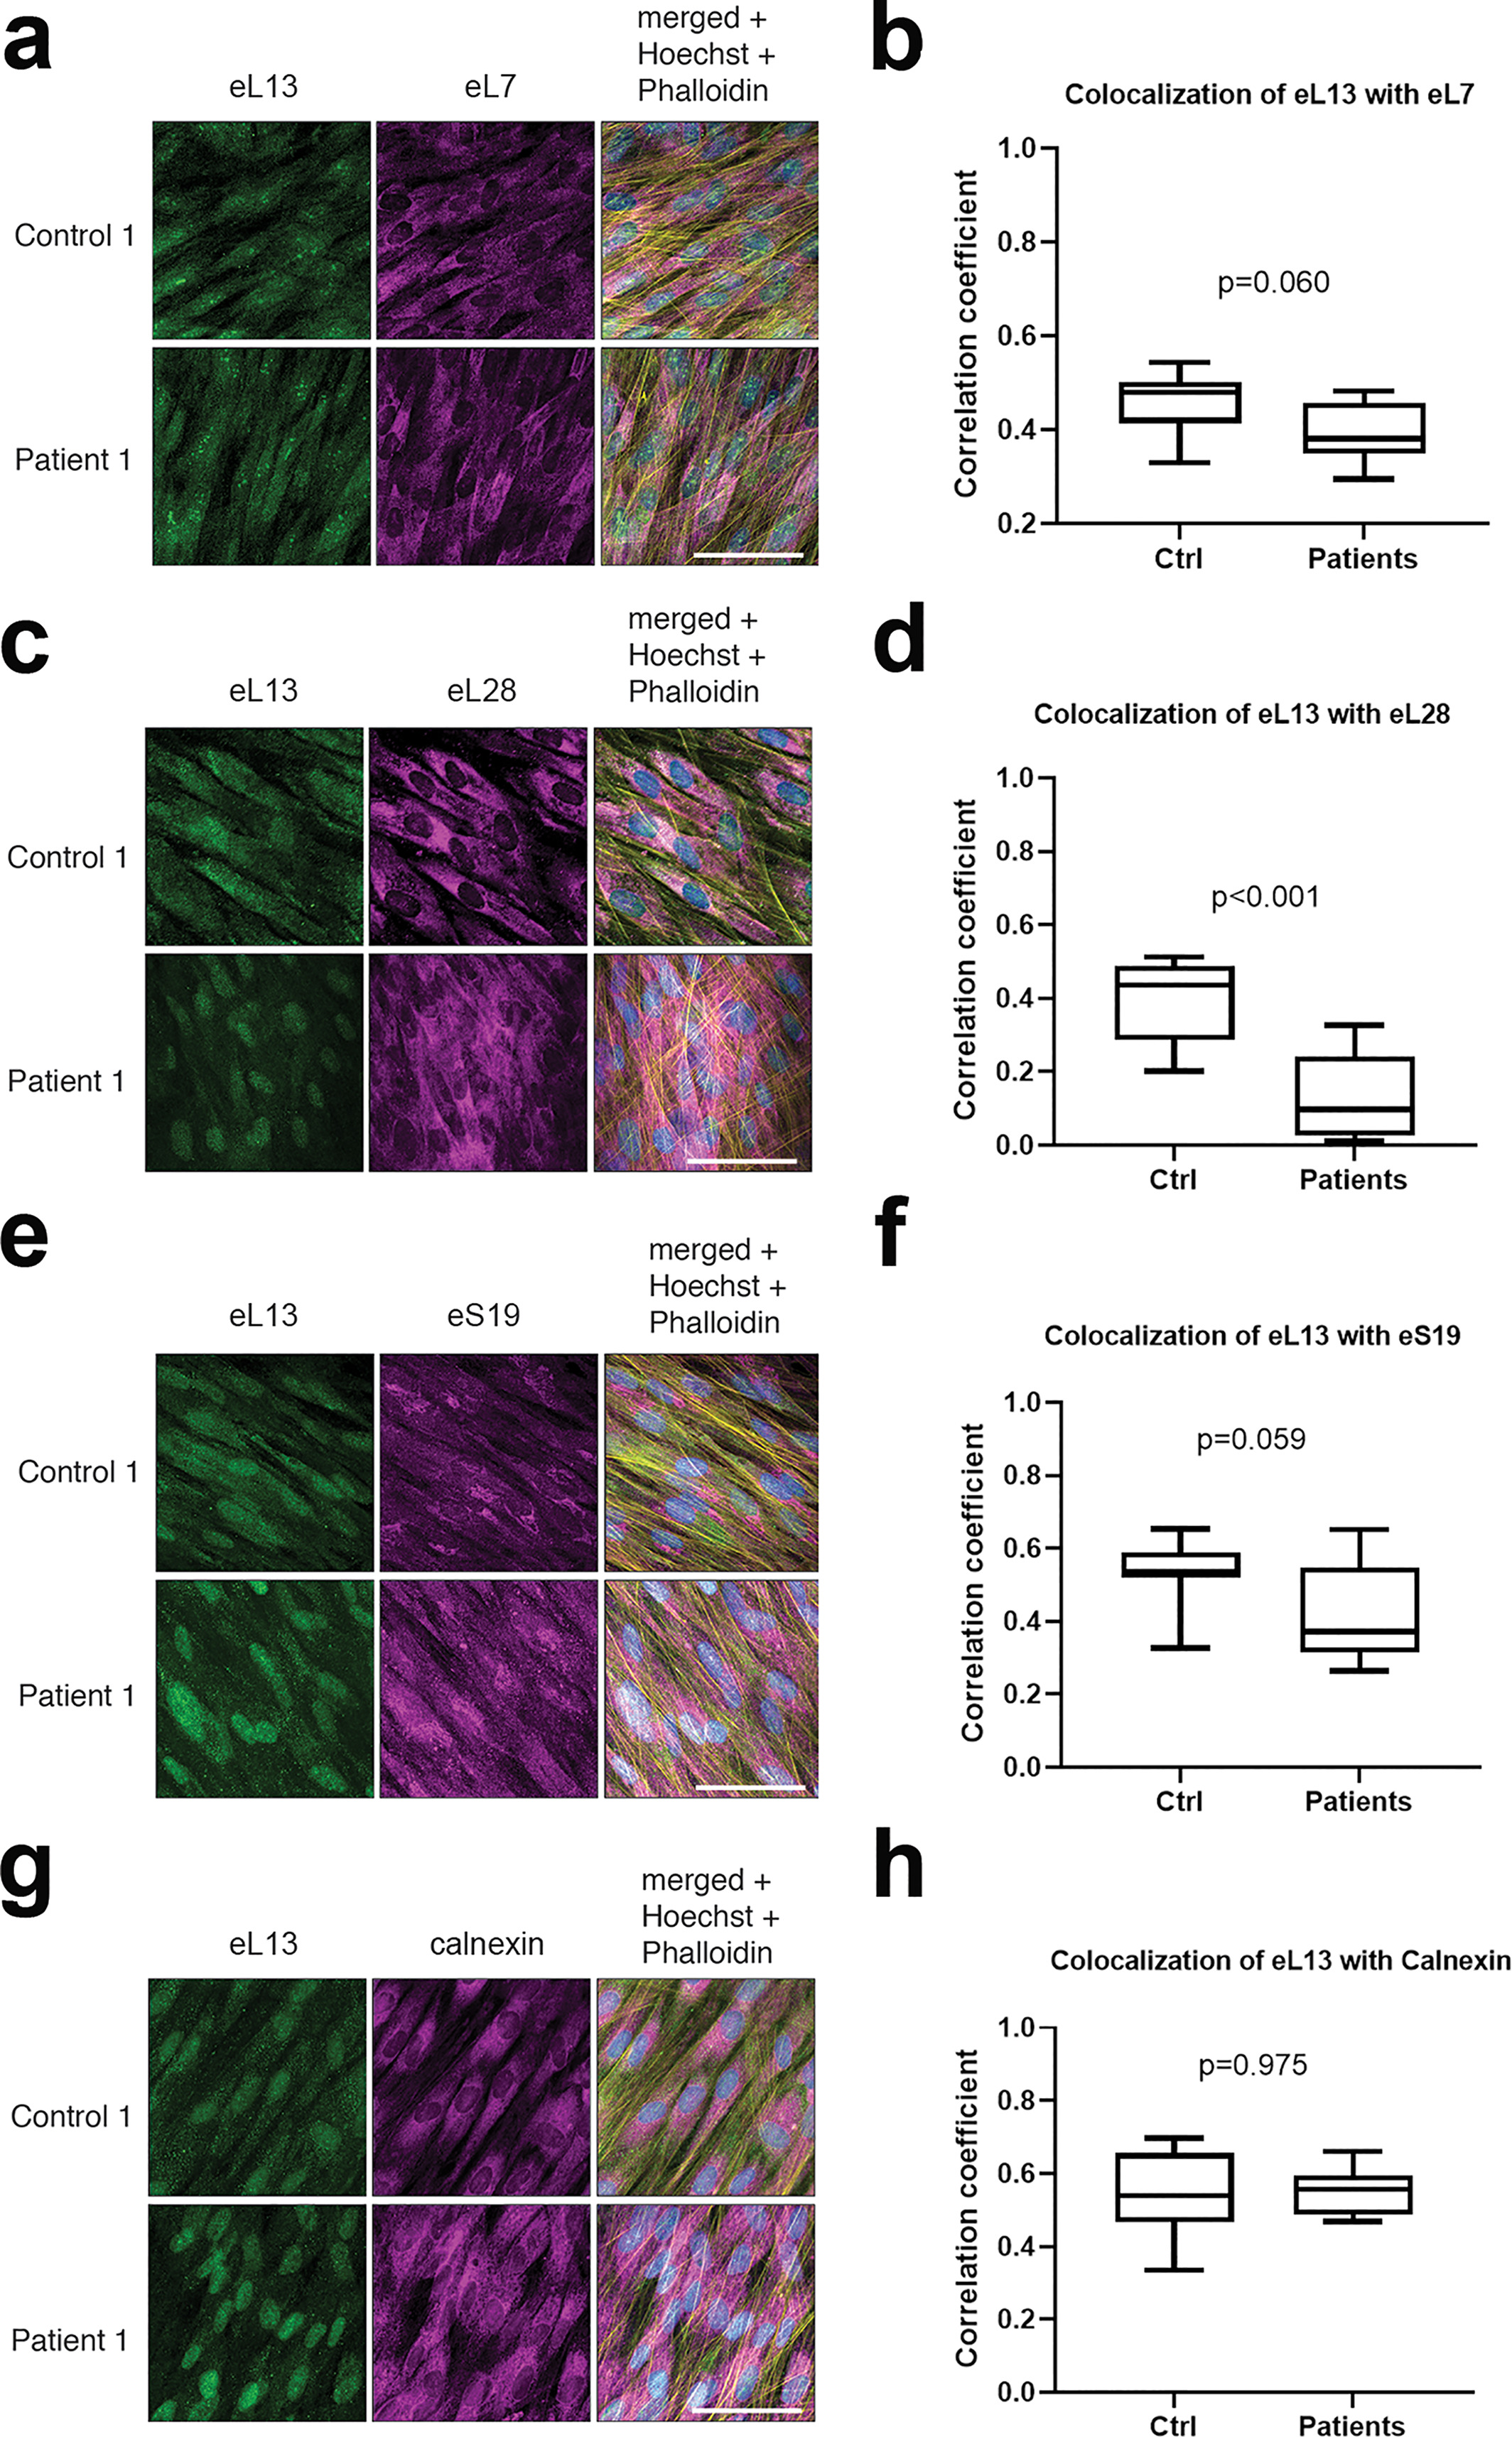
Fig. 4 Comparison of colocalization of eL13 with other ribosomal proteins and with ER. Representative immunofluorescence images of dermal fibroblasts from patient 1 and one healthy control showing co‐staining of eL13 with eL7 (A), eL28 (C), eS19 (E), and with calnexin as a marker of ER (G). Scale bars = 30 μm. 3D colocalization of mutant and WT eL13 with the selected ribosomal markers was analyzed from entire z‐stacks of three samples from patients 1 to 3 (n = 3) and each healthy control (n = 3) using the colocalization test plugin of ImageJ Fiji and is expressed as correlation coefficient (B, D, F, H). Box plots with median and range; p values from Mann–Whitney U test.