
|
Figure 6
Tdrd7 is required for maintaining PGC fate
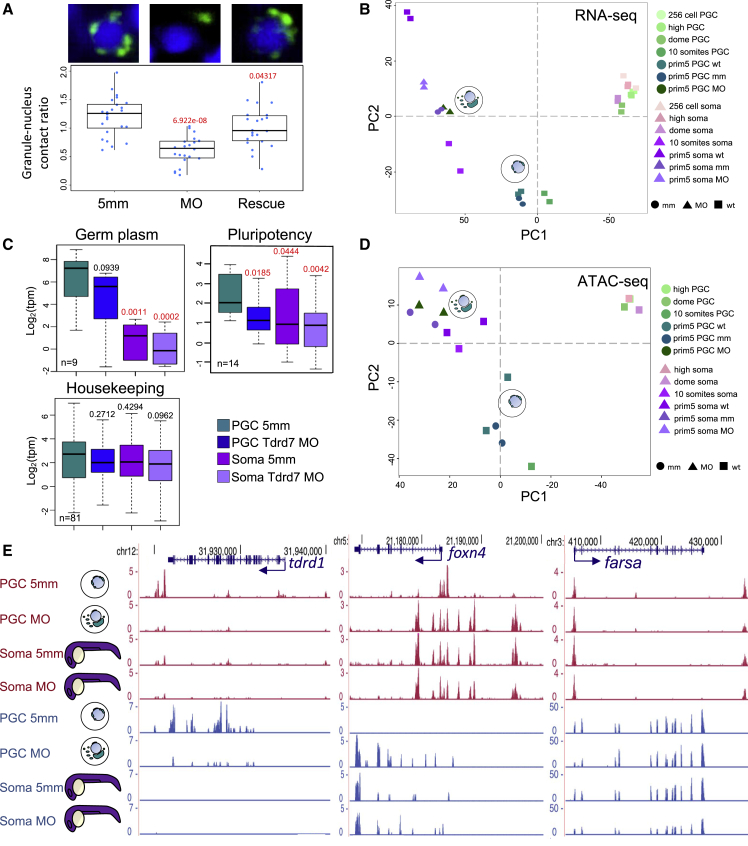
(A) Light-sheet images and phenotypic quantification of
(B) Global transcriptional variance shown as PCA plot for wild-type and MO-injected PGCs and somatic cells.
(C) Boxplots reporting normalized transcript levels (tpm) for gene subsets in MO-injected PGCs and somatic cells. p values against control is shown. Red color indicates significance (p < 0.05, Wilcoxon test). Outliers are omitted.
(D) PCA analysis based on ATAC-seq peaks shows PGCs diverging toward somatic-like chromatin state.
(E) Genome browser view of ATAC-seq profiles after morpholino injections. Open chromatin (ATAC-seq) is shown in magenta and transcript levels (RNA-seq) are shown in blue. Arrows show transcription direction of genes indicated in blue.
Reprinted from Developmental Cell, 56(5), D'Orazio, F.M., Balwierz, P.J., González, A.J., Guo, Y., Hernández-Rodríguez, B., Wheatley, L., Jasiulewicz, A., Hadzhiev, Y., Vaquerizas, J.M., Cairns, B., Lenhard, B., Müller, F., Germ cell differentiation requires Tdrd7-dependent chromatin and transcriptome reprogramming marked by germ plasm relocalization, 641-656.e5, Copyright (2021) with permission from Elsevier. Full text @ Dev. Cell