
|
Figure 4
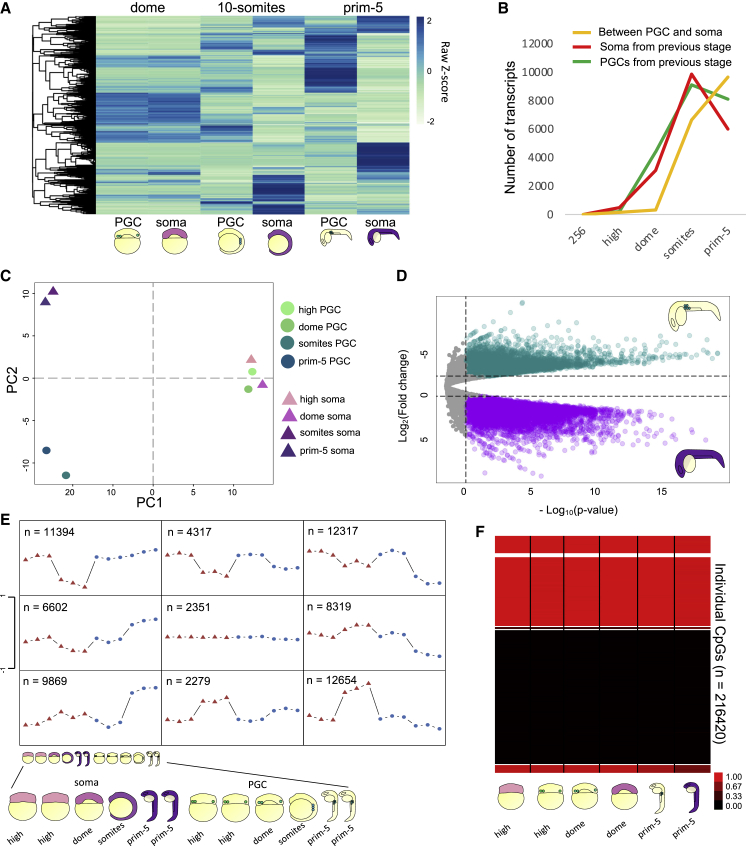
Gradual acquisition of germ identity is accompanied by epigenetic changes
(A) Hierarchical clustering heatmap of differentially expressed genes between PGCs and somatic cells at dome, 10-somites and prim-5 stages. Scale bar represents scaled RPM. padj < 0.1.
(B) Line-chart for gene counts. Upregulated genes from previous stage are in red (somatic) or green (PGCs). The orange line shows number of genes differentially expressed between PGCs and somatic cells at each stage.
(C) Two-dimensional PCA plot of ATAC-seq profiles.
(D) Volcano plot for regions of open chromatin between PGCs and somatic cells at prim-5 stage (log2FC threshold = ±1, padj < 0.05).
(E) Self-organizing map of open chromatin regions. PGCs and somatic cells are shown as blue circles and red triangles, respectively. Schematic of embryos as in
(F) Methylation status of identified CpGs in PGCs and somatic cells at indicated stages.
Reprinted from Developmental Cell, 56(5), D'Orazio, F.M., Balwierz, P.J., González, A.J., Guo, Y., Hernández-Rodríguez, B., Wheatley, L., Jasiulewicz, A., Hadzhiev, Y., Vaquerizas, J.M., Cairns, B., Lenhard, B., Müller, F., Germ cell differentiation requires Tdrd7-dependent chromatin and transcriptome reprogramming marked by germ plasm relocalization, 641-656.e5, Copyright (2021) with permission from Elsevier. Full text @ Dev. Cell