
|
Figure 2
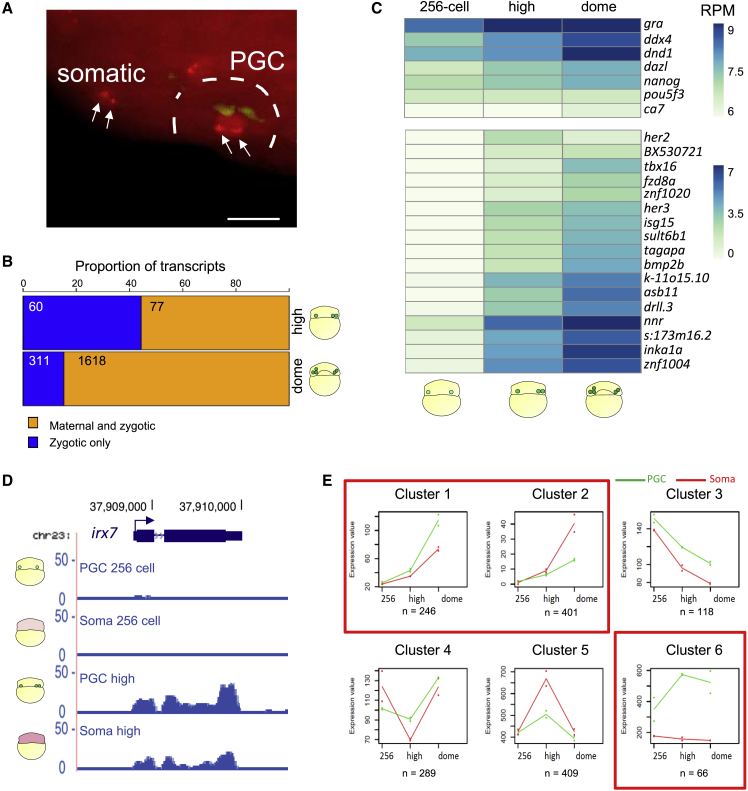
PGCs do not delay the major wave of transcriptional activation
(A) Maximum intensity projection of a multi-stack image showing
(B) Proportion of zygotic and maternal/zygotic genes upregulated in the germ-plasm-carrying cells at high and dome stages.
(C) Expression heatmap of differentially regulated genes in germ-plasm-carrying cells. Scale bar represents scaled RPM. padj < 0.1.
(D) Genome browser view of normalized RNA-seq reads for
(E) Clusters of gene expression trends among three developmental stages in PGCs and somatic cells. Median profiles of gene expression values are plotted for each in green (PGCs) and red (somatic cells) and represent the read counts normalized by the DESeq2-calculated size factor. Red squares highlight clusters supporting transcriptional activation in PGCs.
Reprinted from Developmental Cell, 56(5), D'Orazio, F.M., Balwierz, P.J., González, A.J., Guo, Y., Hernández-Rodríguez, B., Wheatley, L., Jasiulewicz, A., Hadzhiev, Y., Vaquerizas, J.M., Cairns, B., Lenhard, B., Müller, F., Germ cell differentiation requires Tdrd7-dependent chromatin and transcriptome reprogramming marked by germ plasm relocalization, 641-656.e5, Copyright (2021) with permission from Elsevier. Full text @ Dev. Cell