
|
Figure 1
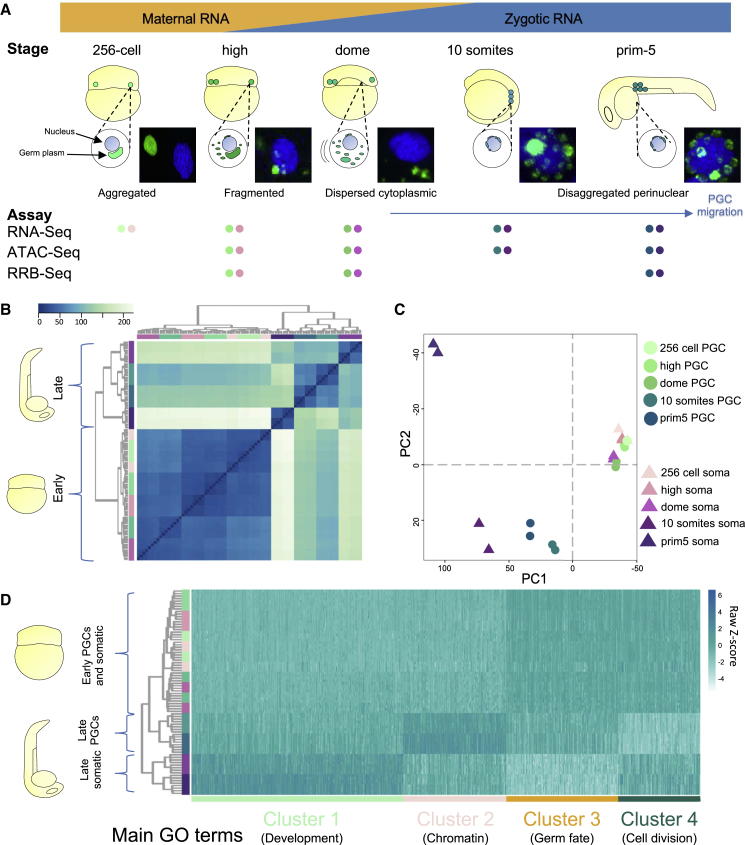
Characterization of PGC transcriptome highlights early developmental similarities and late divergence between PGCs and somatic cells
(A) Developmental stages used in the study are shown. Time points were selected according to various phases of germ plasm distribution/PGCs localization. Early stages span ZGA including the first wave at 256-cell stage. Fluorescent images show nuclei in blue (DAPI) and germ plasm in green (Buc-GFP). NGS assays performed for each time point are shown as colored dots; PGCs and somatic cells are in shades of green and purple, respectively. Data provided in biological duplicates unless stated otherwise.
(B and C) Unsupervised hierarchical clustering heatmap for Euclidean distance and two-dimensional PCA plot show developmental trends of PGC and somatic cell transcriptomes during development. PGCs and somatic cells are in shades of green and purple, respectively.
(D) Groups of differential gene expression reported as normalized transcript heatmap upon k-mean-based clustering over development and cell type.
Reprinted from Developmental Cell, 56(5), D'Orazio, F.M., Balwierz, P.J., González, A.J., Guo, Y., Hernández-Rodríguez, B., Wheatley, L., Jasiulewicz, A., Hadzhiev, Y., Vaquerizas, J.M., Cairns, B., Lenhard, B., Müller, F., Germ cell differentiation requires Tdrd7-dependent chromatin and transcriptome reprogramming marked by germ plasm relocalization, 641-656.e5, Copyright (2021) with permission from Elsevier. Full text @ Dev. Cell