
|
Figure 3
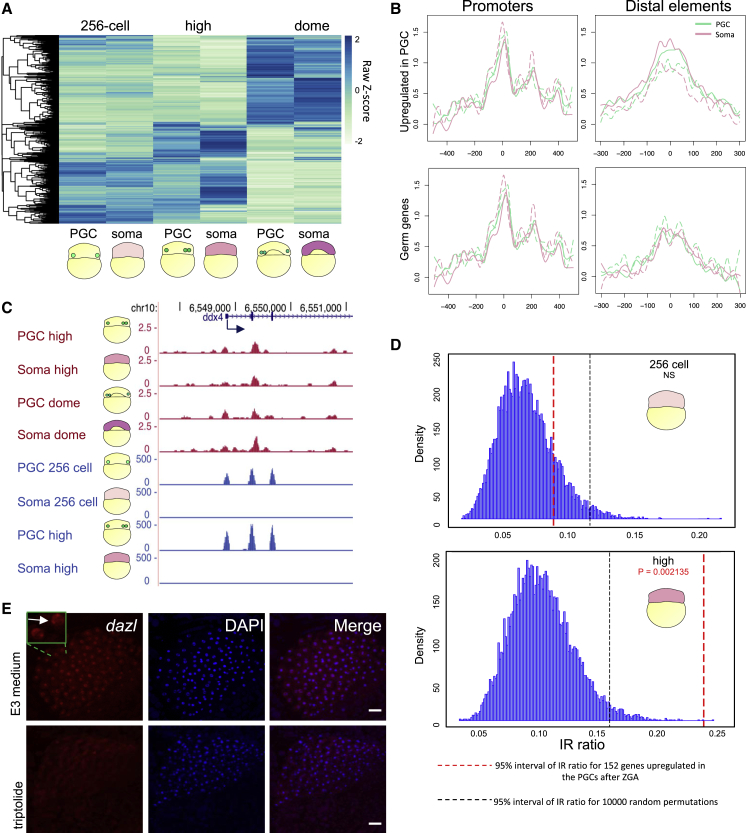
Differential transcriptome between PGCs and somatic cells at early stages is not caused by differential transcription
(A) Hierarchical clustering heatmap of differentially expressed genes between PGCs and somatic cells at indicated stages. Scale bar represents scaled RPM. padj < 0.1.
(B) Average chromatin accessibility signal at promoters and distal elements of PGC and somatic cells (dashed lines for replicates) for subgroups of genes at high stage. Promoters are aligned to transcription start site, while distal elements are aligned to peak center.
(C) Genome browser view of normalized ATAC-seq (magenta) and RNA-seq (blue) reads for PGC and somatic cells at stages spanning ZGA.
(D) Density of IR ratio before and after ZGA in the somatic cells for genes upregulated in the PGCs after ZGA. p value is calculated by t test. Statistical significance was calculated upon 10,000 random permutation whose density is shown before and after ZGA. Black and red dashed lines show 95% significance interval for the 10,000 permutations and the gene subgroup, respectively. NS, not significant.
(E)
Reprinted from Developmental Cell, 56(5), D'Orazio, F.M., Balwierz, P.J., González, A.J., Guo, Y., Hernández-Rodríguez, B., Wheatley, L., Jasiulewicz, A., Hadzhiev, Y., Vaquerizas, J.M., Cairns, B., Lenhard, B., Müller, F., Germ cell differentiation requires Tdrd7-dependent chromatin and transcriptome reprogramming marked by germ plasm relocalization, 641-656.e5, Copyright (2021) with permission from Elsevier. Full text @ Dev. Cell