
Image
|
Figure Caption
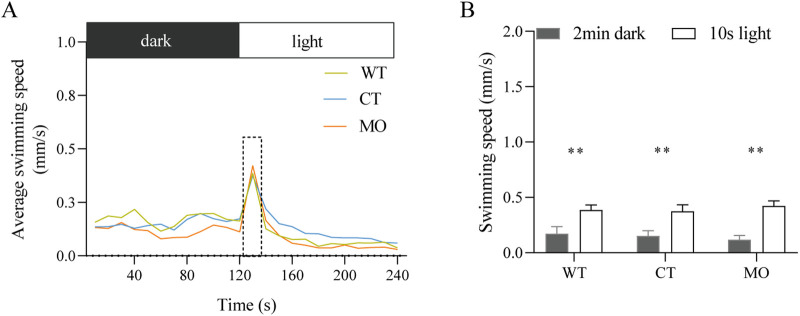
Fig. 4. Response of the zebrafish larvae to the light stimulus at 5 dpf. (A) The average swimming speed of the larvae during the last 2 min dark and 2 min light period. (B) The swimming speed during the last 2 min dark and the first 10 s of the 2 min light period. Results are represented as the mean±s.e.m. (WT, n=35; CT, n=34; MO, n=32). **P<0.01; assessed by one-way ANOVA followed by Tukey's multiple comparisons.
Figure Data
Acknowledgments
This image is the copyrighted work of the attributed author or publisher, and
ZFIN has permission only to display this image to its users.
Additional permissions should be obtained from the applicable author or publisher of the image.
Full text @ Biol. Open