IMAGE

Figure 1

ID
ZDB-IMAGE-210319-85
Source
Figures for Somasagara et al., 2021
Image
Figure Caption

Figure 1

Xenotransplantation of leukemia cells into SCID zebrafish.
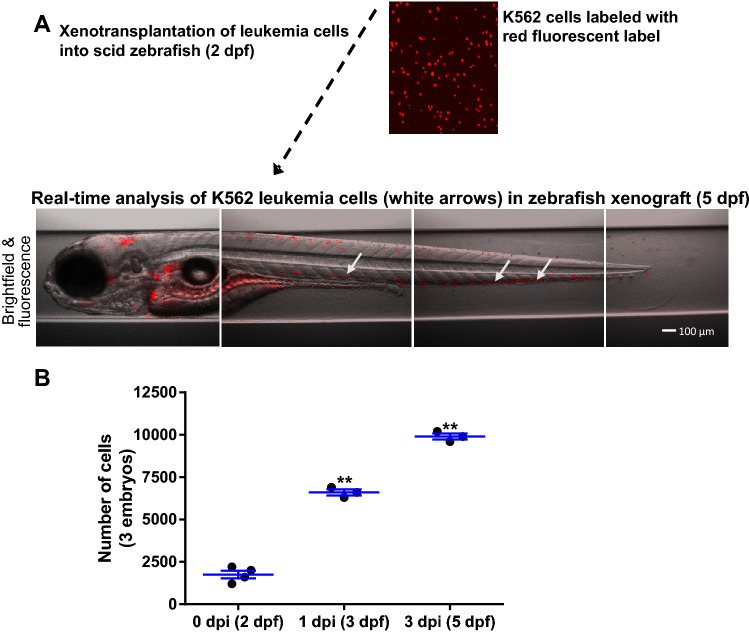
 (A) Microscopic observation of K562 cells at 5 dpf zebrafish xenograft. (B) The 5 dpf zebrafish xenograft embryos were dissociated and labeled leukemia cells were analyzed manually using a hemocytometer. Error bars were calculated based on biological replicates in the experiment. Quantitative values were means ± SEM from 3–4 independent groups of 10 individuals at 3 dpf and 5 dpf. Control at 2 dpf represented the initial transplanted cells into the zebrafish from two separate experiments and showed a consistent amount of transplanted cells. Significance p values were determined as *p ≤ 0.05, **p ≤ 0.01 and ***p ≤ 0.001.

Acknowledgments
This image is the copyrighted work of the attributed author or publisher, and ZFIN has permission only to display this image to its users. Additional permissions should be obtained from the applicable author or publisher of the image. Full text @ Sci. Rep.