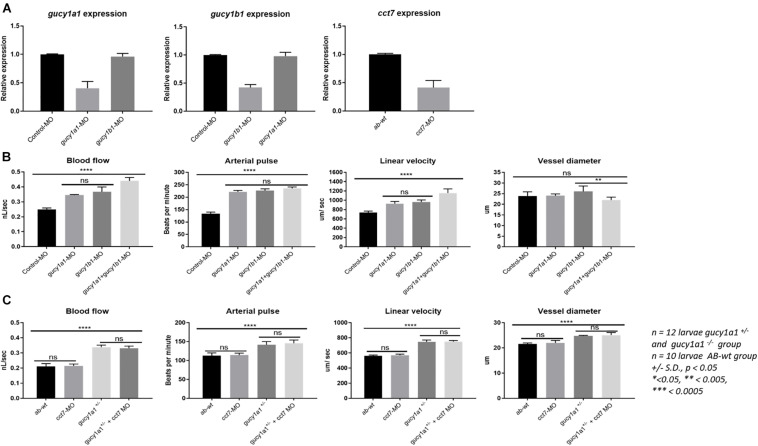
(A) Graphs represent mRNA downregulation of gucy1a1, gucy1b1, and cct7 genes using morpholino (MO) in zebrafish. No cross reactivity of morpholinos was observed between the two subunits of gucy gene in the mRNA expression. (B) Graphs represent comparison of blood flow parameters measured from gucy1a1 (n = 12), gucy1b1 (n = 12), gucy1a1+gucy1b1 (n = 12), and control-MO (n = 10). (C) Graphs presenting comparison of blood flow parameters measured from AB-wild-type (n = 10), cct7-MO (n = 12), gucy1a1+/– (n = 12), and gucy1a1+/– + cct7-MO (n = 12). Data are presented as mean ± standard deviation, significance was set at p < 0.05, and stars denote the significant differences.
This image is the copyrighted work of the attributed author or publisher, and
ZFIN has permission only to display this image to its users.
Additional permissions should be obtained from the applicable author or publisher of the image.
Full text @ Front. Physiol.
Your Input Welcome
Thank you for submitting comments. Your input has been emailed to ZFIN curators who may contact you if
additional information is required.
Oops. Something went wrong. Please try again later.