
Image
|
Figure Caption
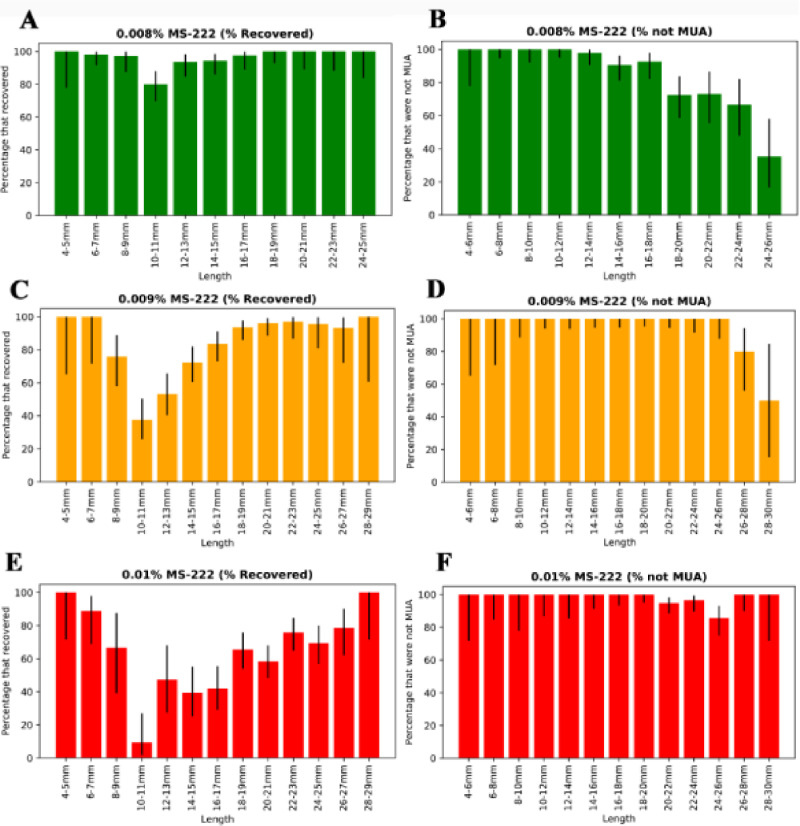
Fig 2
(A), (C), (E) Percentage of fish that recovered by length for concentrations of 0.008%, 0.009% and 0.01% MS-222 respectively. (B), (D), (F) Percentage of fish that were not MUA for concentrations of 0.008%, 0.009% and 0.01% MS-222 respectively. Black lines represent the 90% confidence interval for each value, calculated using the sample size (see
Acknowledgments
This image is the copyrighted work of the attributed author or publisher, and
ZFIN has permission only to display this image to its users.
Additional permissions should be obtained from the applicable author or publisher of the image.
Full text @ PLoS One