
Image
|
Figure Caption
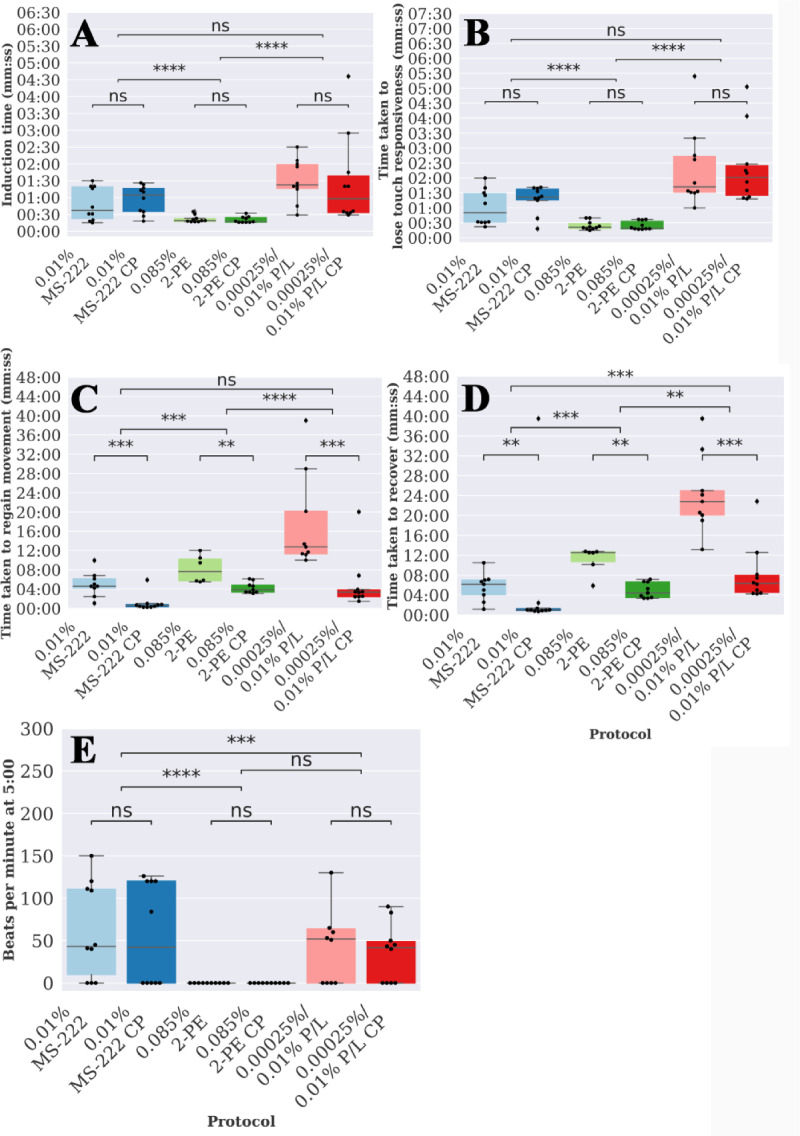
Fig 3
Boxplots of the time taken to (A) induce anaesthesia, (B) lose touch responsiveness, (C) regain movement post anaesthesia and (D) regain equalibrium post anaesthesia for each protocol 1–6 as defined in
Acknowledgments
This image is the copyrighted work of the attributed author or publisher, and
ZFIN has permission only to display this image to its users.
Additional permissions should be obtained from the applicable author or publisher of the image.
Full text @ PLoS One