
Image
|
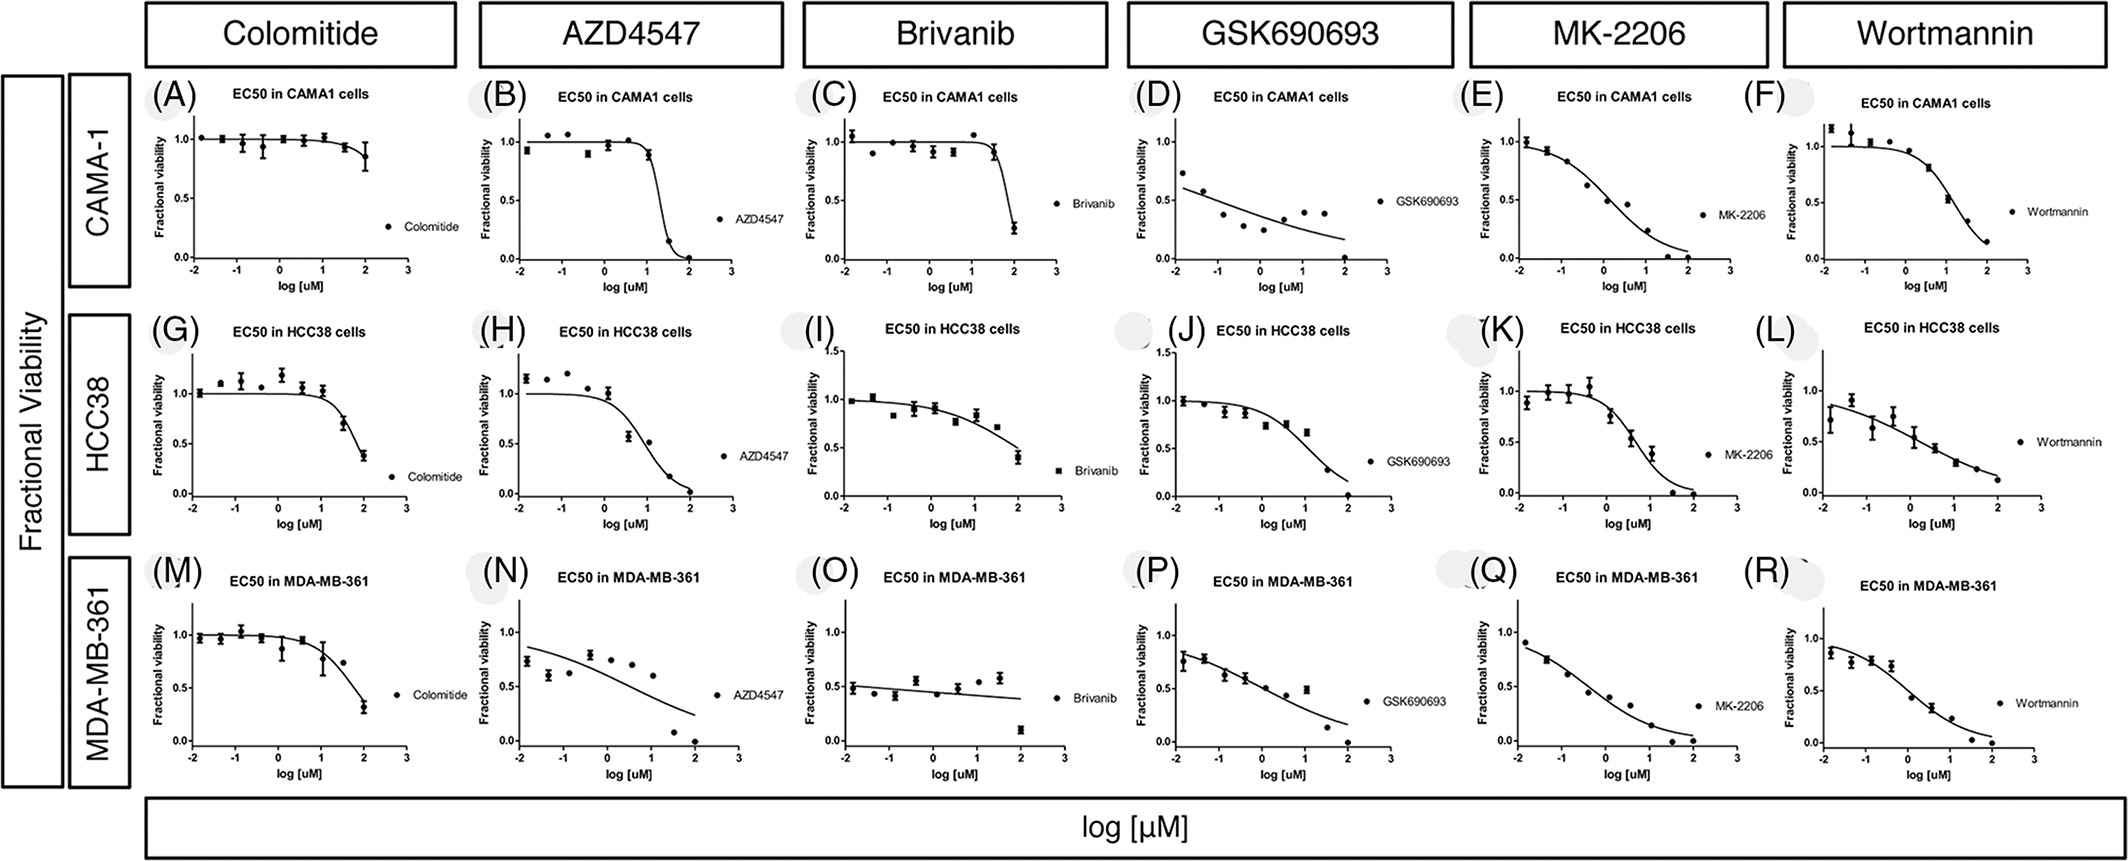
Figure Caption
Fig. 7 Cytotoxicity assay results after treating breast cancer cells lines for 48 hours. Dose‐dependent cytotoxicity assay results after treating CAMA‐1 (A‐F), HCC38 (G‐L) and MDA‐MB‐361 (M‐R) cell lines for 48 hours. Colomitide C (A, G,M), ZAD4547 (B, H, N), Brivanib (C, I, O), GSK690693 (D, J, P), MK‐2206 (E, K, Q) and Wortmannin (F, L, R) were used. The x axis represents the concentration of chemicals on a log10 scale and the y axis represents fractional viability
Acknowledgments
This image is the copyrighted work of the attributed author or publisher, and
ZFIN has permission only to display this image to its users.
Additional permissions should be obtained from the applicable author or publisher of the image.
Full text @ Dev. Dyn.