
Image
|
Figure Caption
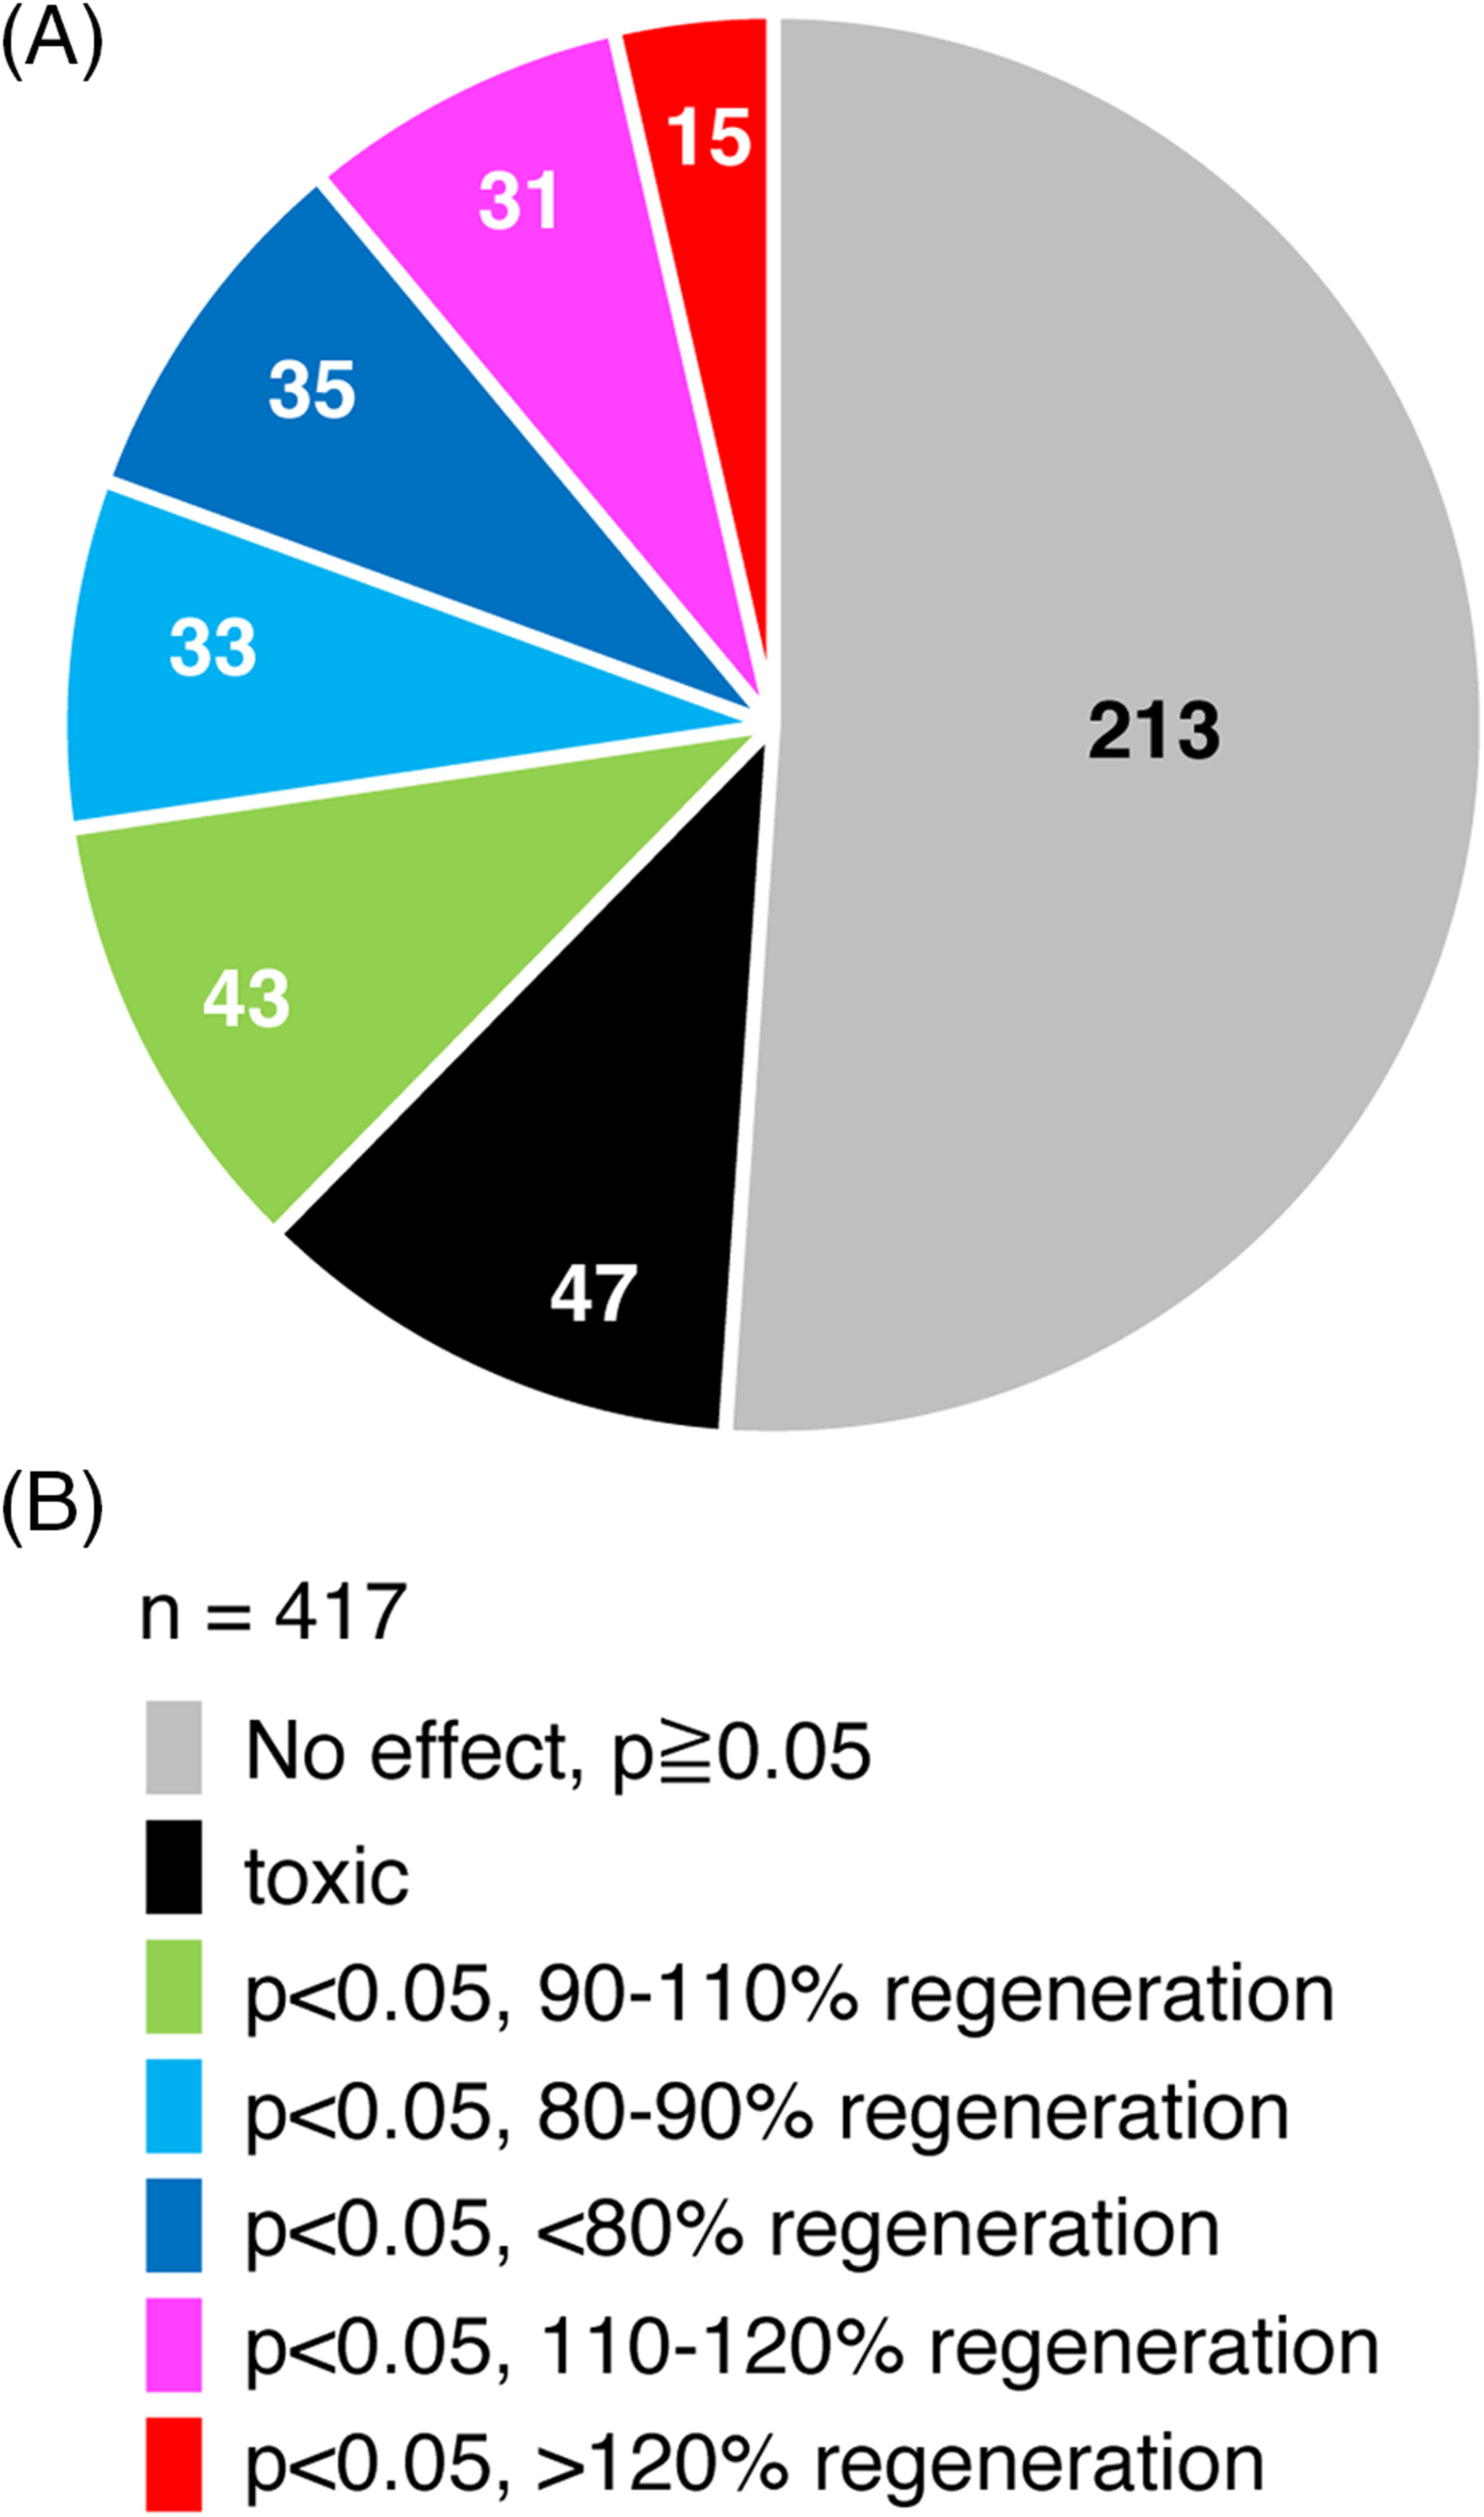
Fig. 2 Summary of larvae fin regeneration screening. A, Summary of experiments with 429 unique compounds/extracts are shown as a pie chart. The number in each fraction shows the number of fractions or purified compounds. B, Color‐coding of the results shown in A
Acknowledgments
This image is the copyrighted work of the attributed author or publisher, and
ZFIN has permission only to display this image to its users.
Additional permissions should be obtained from the applicable author or publisher of the image.
Full text @ Dev. Dyn.