
|
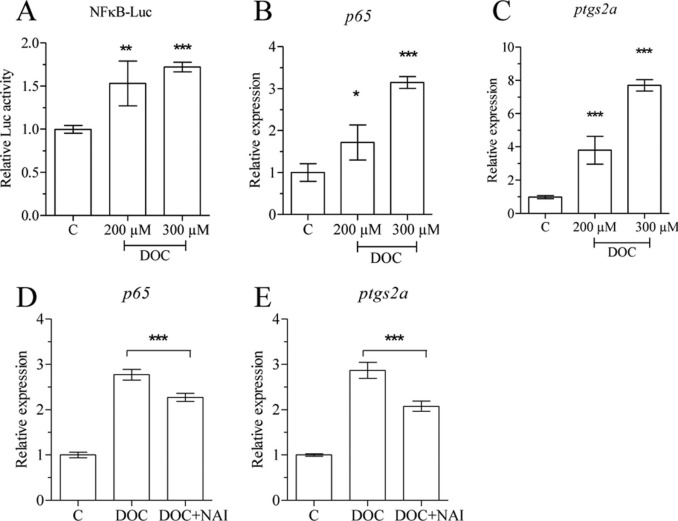
Fig. 5 FIGURE 5. DOC activates NFκB and up-regulates p65 and ptgs2a expression in vitro. nZFL were exposed to DOC (200 μm, 300 μm) for 12 h, and luciferase activity was analyzed to check NF-κB activation (A). ZFL cells were exposed to DOC (200 μm, 300 μm) alone and combination (200 μm DOC) with NAI (40 nm) for 24 h, and total RNA was extracted followed by qRT-PCR analysis of p65 (B and D) and ptgs2a (C and E) expression. The statistically significant difference between groups was determined using Student's t test (*, p < 0.05; **, p < 0.01; ***, p < 0.001). n = 4. Error bars represent the mean ± S.D.