
|
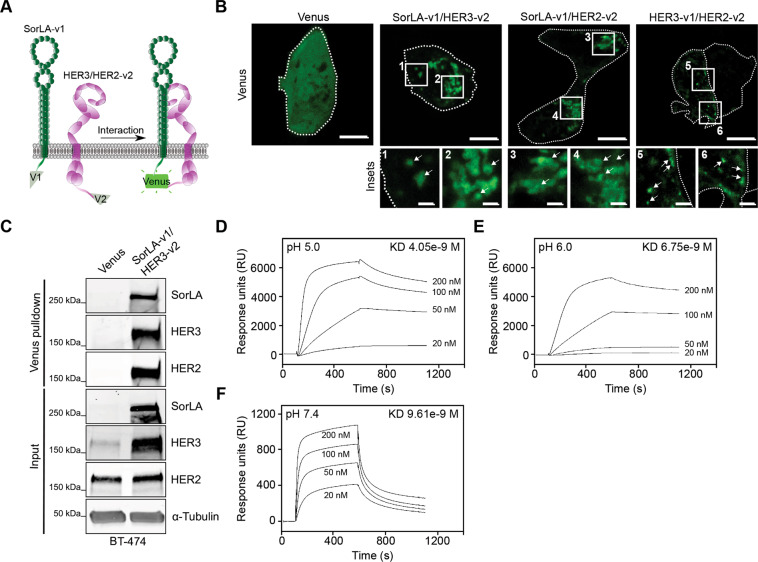
Fig. 4 A A scheme depicting BiFC between SorLA-v1 and HER2/3-v2. B The indicated BiFC dimers were expressed in BT-474 cells and their interaction was assessed through imaging of reconstituted Venus. Cells are outlined with white dotted lines. Shown are representative confocal microscopy images and a control Venus-expressing cell showing diffuse fluorescence localization. Scale bars (main): 10 µm. Scale bars (insets): 2 µm. C Venus or SorLA-v1/HER3-v2 were transiently expressed in BT-474 cells. Cell lysates were subjected to nanobody pulldown (specific for the reconstituted Venus v1 + v2 dimer) and pulldowns and total cell lysates (input) were immunoblotted with the indicated antibodies. D–F. SorLA interacts with HER3 in a pH-dependent manner. SPR analysis on immobilized SorLA and a 20–200 nM concentration series of HER3 at pH 5.0 (D), 6.0 (E) and 7.4 (F). KD: equilibrium dissociation constant. Data are representative of three independent biological replicates.