IMAGE

Fig. 1

ID
ZDB-IMAGE-210307-81
Source
Figures for Al-Akhrass et al., 2021
Image
Figure Caption

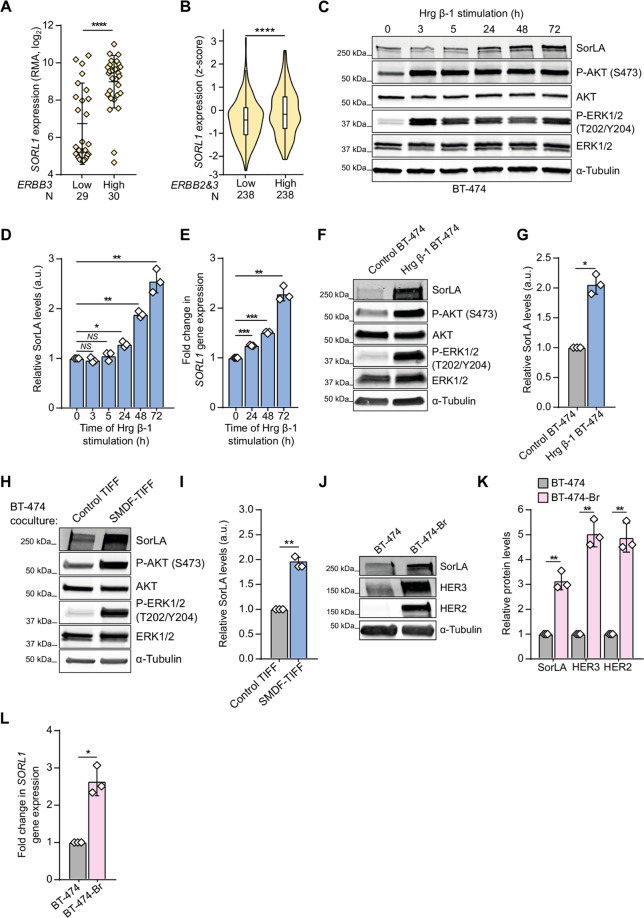
Fig. 1 HER3 signaling regulates <italic>SORL1</italic> expression.

ASORL1 expression is significantly higher in breast cancer cell lines with high ERBB3 expression (CCLE; N = 59). RMA: robust multi-array average. Data are mean ± SD; statistical analysis: Mann–Whitney U. BSORL1 expression is higher in tumors with high ERBB3 and ERBB2 expression (cBioPortal; N = 476). Violin plot boxes represent median and 25th and 75th percentiles (interquartile range), and whiskers extend to maximum and minimum values. See methods for details on how the groups were defined. C Hrg β-1 increases SorLA levels. BT-474 cells were stimulated with 20 ng.mL−1 Hrg β-1 for the indicated times. Representative immunoblotting of SorLA, AKT(p)S473, total AKT, ERK1/2(p)T202/Y204, total ERK1/2, with α-tubulin as a loading control. D Quantification of SorLA levels normalized to loading control and relative to non-stimulated (0 h) cells. E Hrg β-1 increases SORL1 expression. Quantification of SORL1 mRNA levels, relative to HPRT1, determined with RT-qPCR in BT-474 cells stimulated with 20 ng.mL−1 Hrg β-1 for the indicated time points relative to non-stimulated (0 h) cells. F Representative immunoblotting of SorLA, AKT(p)S473, total AKT, ERK1/2(p)T202/Y204, total ERK1/2, with α-tubulin as a loading control from control (mCherry)- or Hrg β-1-overexpressing BT-474 cells. G Quantification of SorLA levels normalized to loading control and relative to control cells. H SMDF increases SorLA expression. BT-474 cells were cultured on a monolayer of mCherry-positive control or SMDF-overexpressing fibroblasts (TIFF). BT-474 cells were FACS sorted (see “Methods”) and cell lysates were analyzed for SorLA, AKT(p)S473, total AKT, ERK1/2(p)T202/Y204, total ERK1/2, with α-tubulin as a loading control. I Quantification of SorLA levels normalized to loading control and relative to control TIFF cocultured cells. J Representative immunoblotting of SorLA, HER2, and HER3, with α-tubulin as a loading control from parental BT-474 and brain-tropic metastasis variant BT-474-Br cells. K Quantification of indicated protein levels normalized to loading control and relative to BT-474 cells. L Quantification of SORL1 mRNA levels, normalized to HPRT1, determined with RT-qPCR in parental BT-474 and BT-474-Br cells relative to BT-474 cells. Unless otherwise indicated, data are mean ± SD from three independent biological experiments; statistical analysis: Student’s t test (unpaired, two-tailed, unequal variance).

Acknowledgments
This image is the copyrighted work of the attributed author or publisher, and ZFIN has permission only to display this image to its users. Additional permissions should be obtained from the applicable author or publisher of the image. Full text @ Oncogene